
DATA DATA DATA!!! From large multinational conglomerates to measly small start-ups data is everything. Be it an IT start-up, a retail store or even football yes football data is everything. Back in 2014, the sole reason Germany won the football world cup is because of data analytics. Data analytics is where we try to gain useful insights from the data that is stored in the database or the data warehouse which will help to achieve the goals of the organization. Let us see how Splunk can be beneficial for business analytics using comapnies data.Here we will see how Big data analytics can even be used to setup a sustainable business model.


References:-
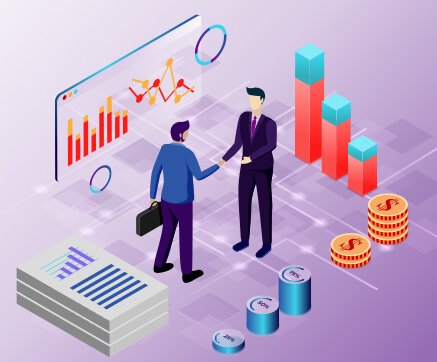
Let’s take an example of a retail store business.
Like every other businesses it faces its highs and lows. We will see how an analytic tool will help us to get deep insights on their business model so that a decision can be made before major setbacks. Here, in this example we use a Myanmar superstore market which has multiples branches across multiple cities in Myanmar. They used Splunk to get to know:-
- Which city has the highest profit?
- Which product is selling in a profit based on the season?
- Which product has the least amount of sales?
- Which gender buys more products?
- What kind of transaction is being used the most?
- Which product has the highest profit margin?
- Which product has the least profit margin?
With all the above information we can create as sustainable business model.
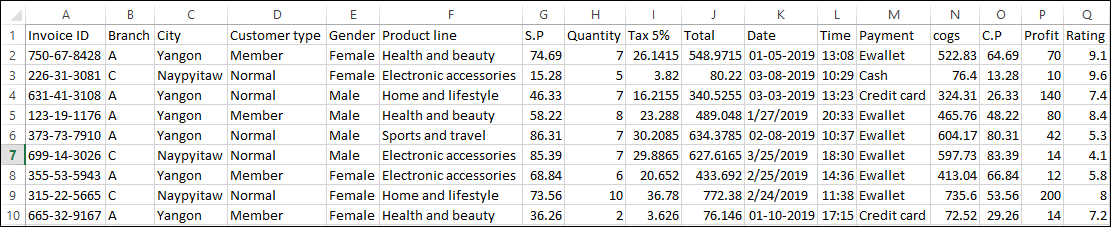
“The above image shows the data of a retail store with multiple branches. Abbreviations’ are given below.”
-
S.P – Selling PriceCogs – Actual price without taxC.P – Cost Price
We can index the data into Splunk, create a dashboard and try to get meaningful insights out of it which will further help the growth of the organization to new heights.
Solution provided by Avotrix to one of its retail clients along with its dashboard.
Let us take the following panel for example.
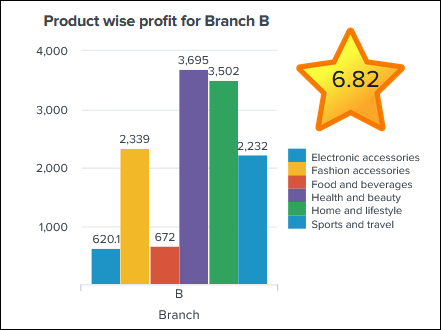
The above image is a pie chart which shows us the product wise profit with respect to branch.
From the above image we can get an inference that in branch B electronic accessories and food & beverages have the least amount of profit as compared to the other products. Based on this new insight, we can increase the profits of these 2 products by offering better offers or discounts to these products while increasing the no of these products being sold as well. Let us focus on another panel.
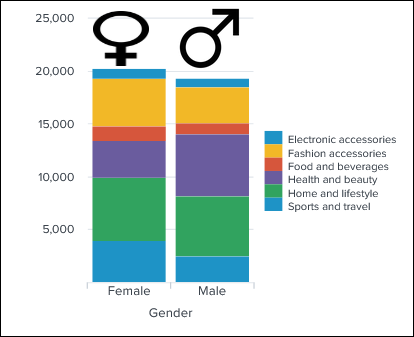
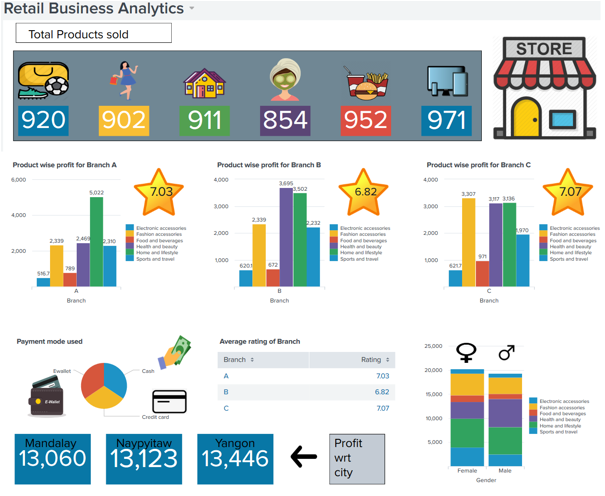
The above panel shows the profit with respect to product and gender. From the image we can come to a conclusion that females shop more than males. So from the inference we can target the female audience as compared to the males as females spend more on these products than males.
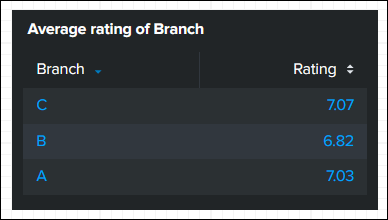
From the above panel we can come to a conclusion that branch B has the lowest rating and that needs to be increased while the ratings of branch A and C are similar.
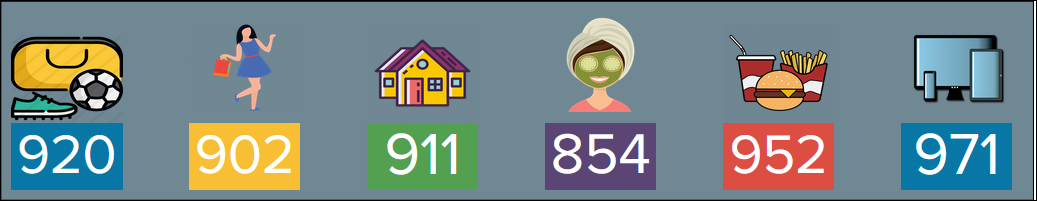
From the above panel we can come to a conclusion that across 3 branches health and beauty has the least products and we can add certain offers on these products to increase their sales. The other conclusion is that across 3 branches, electronic accessories has the highest amounts of products sold.
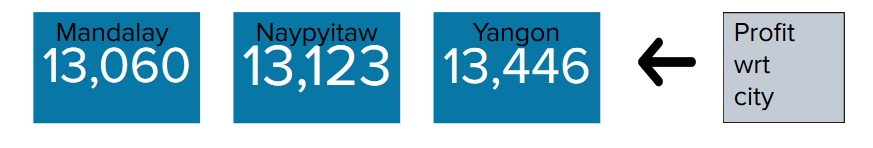
From the above panel we can come to a conclusion that across 3 cities Yangon has the highest profit and Mandalay has the least profit.
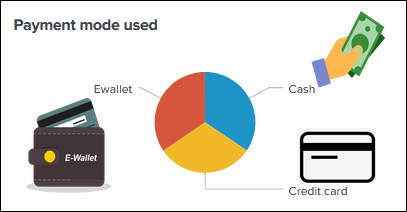
From the above panel we can come to a conclusion that people are using e-wallets the most with cash the second and credit card the least. From this insight, we can add offers towards customers using e-wallets there by increasing the amount of sales of these customers by having they buy more products.
Data science is seen as the new field that is transforming and taking each and every industry to new heights. If you are a person who’s interested in this field and want to take courses such as Big data analytics contact Avotrix.com
References:-
How Germany used data for business analytics:
If you are still having any questions regarding this topic Feel free to Ask Doubts in the Comment Box Below and Don’t Forget to Follow us on 👍 Social Networks, happy Splunking >😉


