

In this blog we are going to discuss about Network Diagram Viz in splunk. As we all use Splunk for data onboarding, creating knowledge objects, creating Dashboards from that data to get insights on that data. This all steps is been architected using Splunk components which includes universal Forwarders, Heavy Forwarder, Deployments Servers, Indexers, Search Heads etc.
What is need of Network Diagram Viz?
Network Diagram Viz is an app on Splunk base which allow us to create entities and show relationships between them entities can be referred as Splunk Components which are UF, HF, DS, SH and to show relationship between them which component is connected to which component etc.
Using Network Diagram Viz visualization we can able to find workflow between the servers in Splunk. If any of the servers go down we can show them using colors as well
Viz Diagram help us to show whole architecture of Splunk or anything we want as per our data and to get proper insights of the components working or not or the flow of the data is been stopped or not and any error prone component which can be lead to further dismissal of whole architecture.
Today we are going to know more of Network Diagram Viz Visualization with an example of Network Traffic Logs where we can able to find which sources of IP flowing their data to Destinations IP
Use Cases of Network Diagram Viz
1) Network Viz Visualization can be used to examine Active servers in a environment.
2) To display current usage of system by CPU, I/O, Memory, Hardware etc.
3) To Visualize the connection between the Hosts and Servers.
4) To Track the host which are sending high amount of errors.
5) To manage amount of data sending and receiving from Source to Destinations.
Steps to install Network Diagram Viz from Splunk base
1) Login to Splunk using your username and password
2) In homepage click on gear icon beside Apps.
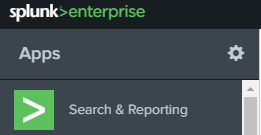
3) Getting into Manage Apps for installing new App Click on Browse more apps.

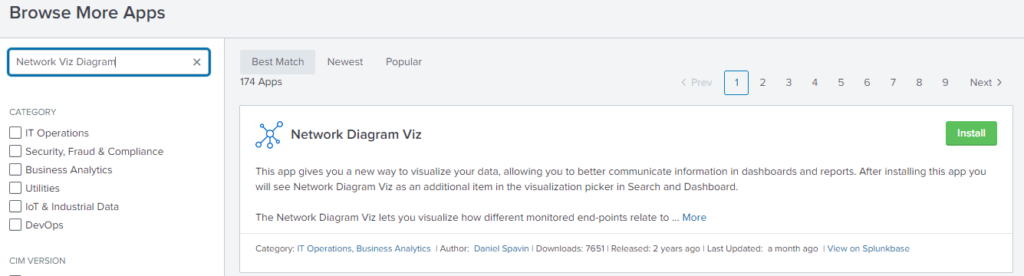
4) In textbox type Network Diagram Viz then in right hand side the Network Diagram Viz App will appear following with Install button. Click on Install
5) They will further ask for username and password here you should enter username and password of the Splunkbase.com account credentials not which you used to enter when log in to Splunk.
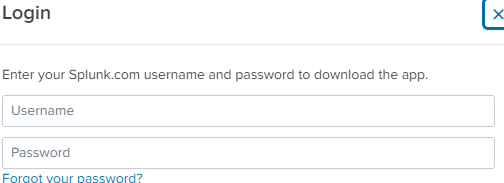
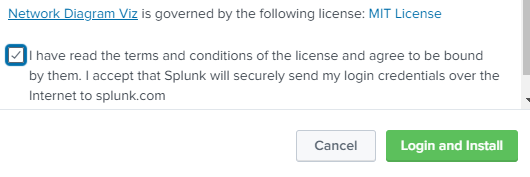
6) After entering Username and Password please select the T&C checkbox and select Login and Install.
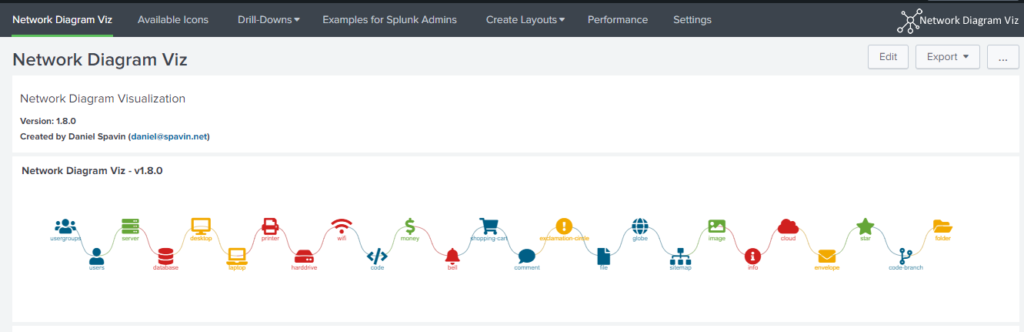
7) Then you can able to see in Splunk homepage the Network Diagram Viz app is installed. By clicking on the app you can then able to see this below page where details and example could be seen of Network Diagram Viz.
To create a Visualization in Dashboard from Network Diagram Viz we need to understand the field names which needs to be mapped. Network Viz has predefined field names we need to mapped them from our data set to create visualization.
Field Names are as follows:
1 – from(required) : It is the Source field name which is needed e.g. src_ip
2 – to : It is the Destination field name which is needed e.g. dst_ip
3 – value : It is the value of the entity when clicked on it. It furthers be passed to other panels as a drilldown when it is clicked
4) nodeText : It displays below the entity we can called as node also.
5) type : It uses the icon in Network Diagram Viz which will be displayed as node e.g. users,desktop, globe etc
6) color : It will display the node in color that we wanted e.g. yellow, red, green etc
7) linkText : links are the directed edges which keeps connected from and to fields, linkText are the text which we want to displayed on them.
8) linkcolor – It will show the links in the color which we set
9) linkwidth – It is the link width between 2 nodes it ranges from 0 to 15.
10) linkkength – It is the link length between 2.
We will be creating a Dashboard panel using Network Diagram Viz. It is for the data where we want to construct a architecture of Connecting VPN Server with Public Address and from that VPN Server we are getting new VPN IP.
We are getting logs from SSL VPN category where query is index=firewall sourcetype=syslog cat=”SSL VPN”, Here we have 2 fields src_ip and Destination IP by mapping these 2 field in from and to field we can create a Network Diagram Viz
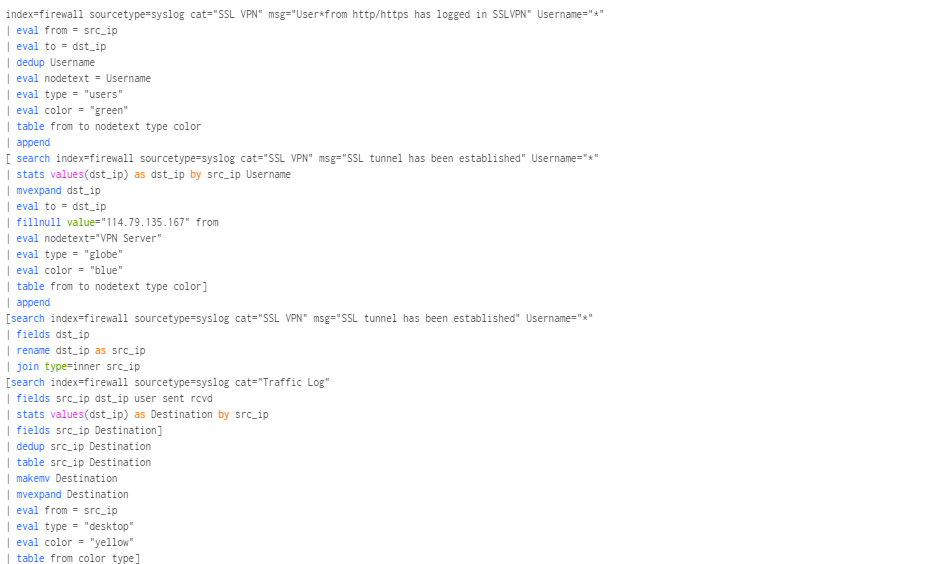
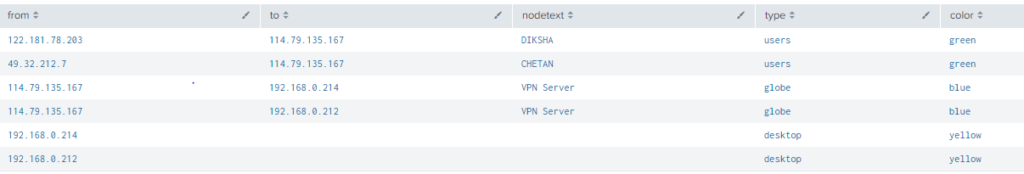
In above query we have mapped the src_ip and dst_ip in from and to fields, following with the nodetext which will be displayed as text below the user entity, type is set as users,globe and desktop for example for Public IP nodeText is given as Username from the logs type is set as Users icon and color is set as green same goes to other entities.
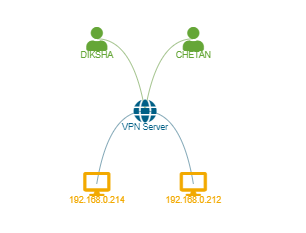
Above is the Network Diagram Viz visualization from the above query generated. Using this Network Diagram we can create much more complicated architecture where we can find the Source IP’s connecting to which Destination IP and sending and receiving the amount of data. Also we can save this architecture is form of Dashboard also.
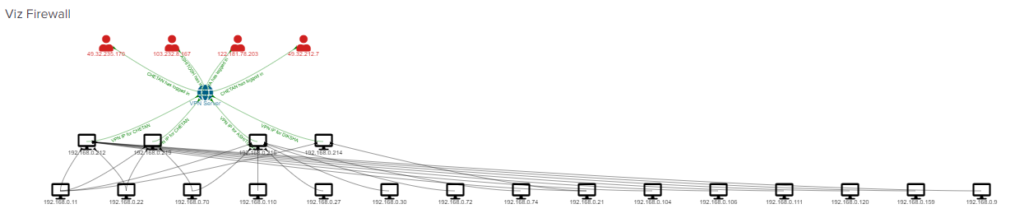
Here is the another example where we can get Public IP connecting to VPN Server after that VPN Server is assigning a new VPN IP to user then from that VPN IP user is hitting different Destinations.
If you are still facing issue regarding Network Diagram Viz in Splunk connector Feel free to Ask Doubts in the Comment Box Below and Don’t Forget to Follow us on 👍 Social Networks😉 Happy Splunking >


