

As we know as an analyst while making dashboards, alerts or understanding existing dashboards we can come across many stats commands which can be challenging for us to understand but actually they make work easy. So let’s see how this stats commands works .What are stats command in Splunk?
The statistics commands are used to calculate summary statistics on the search results from events retrieved from an index. The statistics commands works on the search results as a whole and returns only the fields that you specify.
Different types of stats commands?
- stats
- eventstats
- streamstats
- tstats
So let’s go one by one.
Stats
Stats calculate aggregate statistics over the dataset, similar to SQL aggregation. If called without a by clause, one row is produced, which represents the aggregation over the entire incoming result set. If called with a by-clause, one row is produced for each distinct value of the by-clause.
You will mostly be using stats command although it has couple of sibling’s i.e. eventstats and streamstats.
There are number of statistical functions available like avg() , count() , distinct_count() , median() , stdev() , sum() , sumsq() , etc.
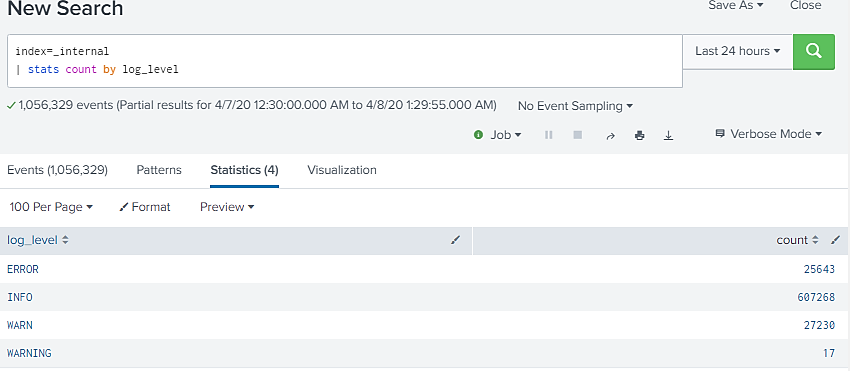
In above example stats command has returned 4 statistical results for field “log_level” with count of each value in that field.
Eventstats
Eventstats calculates a statistical result same as stats command only difference is it does not create statistical results, it aggregates them to the original raw data.
When we use stats command and get some results , splunk don’t know the original fields and only the fields which are included in results. This is where eventstats command becomes helpful.
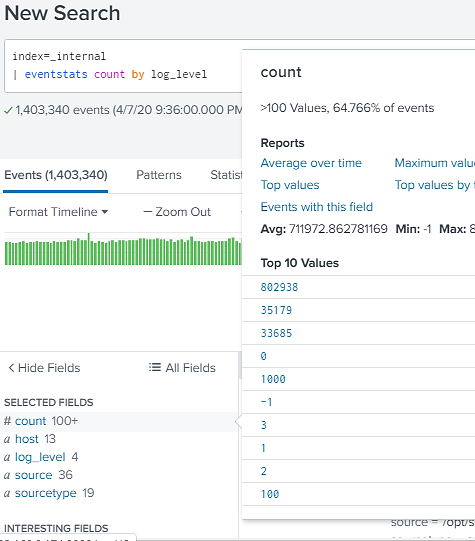
As you can see in above example newly created “count” field is present as well as original fields like “log_level” and “class” are available too.
Streamstats
streamstats is helpful when we are interested in statistical in streaming manner, same as eventstats, streamstats aggregates the statistics to the original data, so all of the original data is accessible for further calculations.
This command uses events before the current event to compute the aggregate statistics that are applied to each event.

In above example its calculating the sum of the value of “status” with respect to “method” and for next iteration its considering the previous value.
Tstats
tstats is faster than stats, since tstats only looks at the indexed metadata that is .tsidx files. (i.e., only metadata fields- sourcetype, host, source and _time).
tstats can run on the index-time fields from the following methods:
• An accelerated data models
• A namespace created by the tscollect search command
• Index-time fields manually via fields.conf, props.conf, and transforms.conf
The indexed fields can be from normal index data, tscollect data, or accelerated data models.

I hope from the above explanation you have got a clear view about stats commands and their uses. So next time if you see any splunk dashboard or developing your own dashboard you know what is the best stats command in that scenario.
Kindly comment for more splunk topic. Will be grateful to provide you with the solution.


