Before installing the OCI Addon on Splunk, some setup needs to be completed on the Oracle Cloud Infrastructure (OCI) Console. This ensures that logs are efficiently transmitted from OCI to Splunk. The following steps outline the process.
Understanding Log Transmission
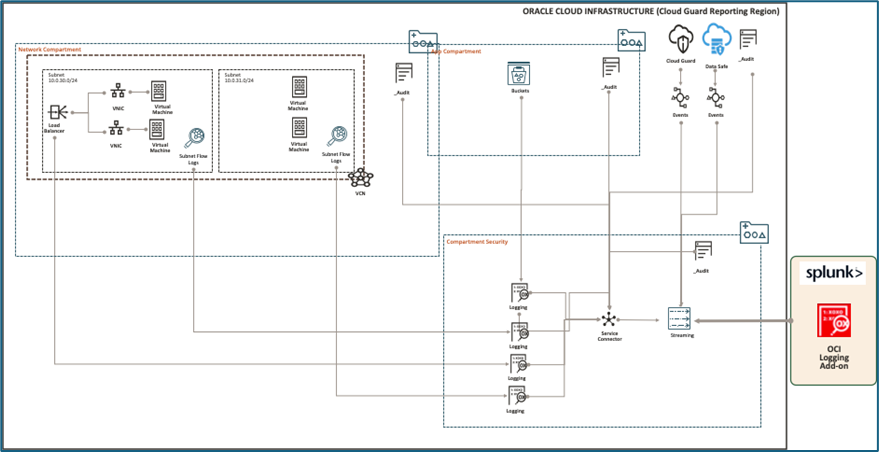
To understand how logs are collected and transmitted to Splunk, refer to the following flowchart of the OCI infrastructure.
OCI Services → Logging → Service Connector → Streaming → Splunk
- OCI Services (Oracle Cloud Infrastructure) provides a comprehensive cloud platform with various tools to store, manage, and process data efficiently. Among its key services:
- Logging collects and stores activity logs from OCI infrastructure for monitoring and analysis.
- Service Connector acts as a bridge between Logging and Streaming, automating data movement within OCI. It enables seamless integration by transferring logs and event data from Logging to Streaming, where real-time processing and external tool integration can take place.
- Streaming enables real-time data processing and transfers it to external tools for eg Splunk, acting as a continuous data pipeline.
- Splunk: offers powerful analytics and visualization capabilities. The OCI Add-on for Splunk seamlessly integrates OCI services with Splunk, enabling efficient ingestion and analysis of logs, metrics, and streaming data.
Step 1: Create a Stream in the OCI Console
- Navigate to the OCI Console.
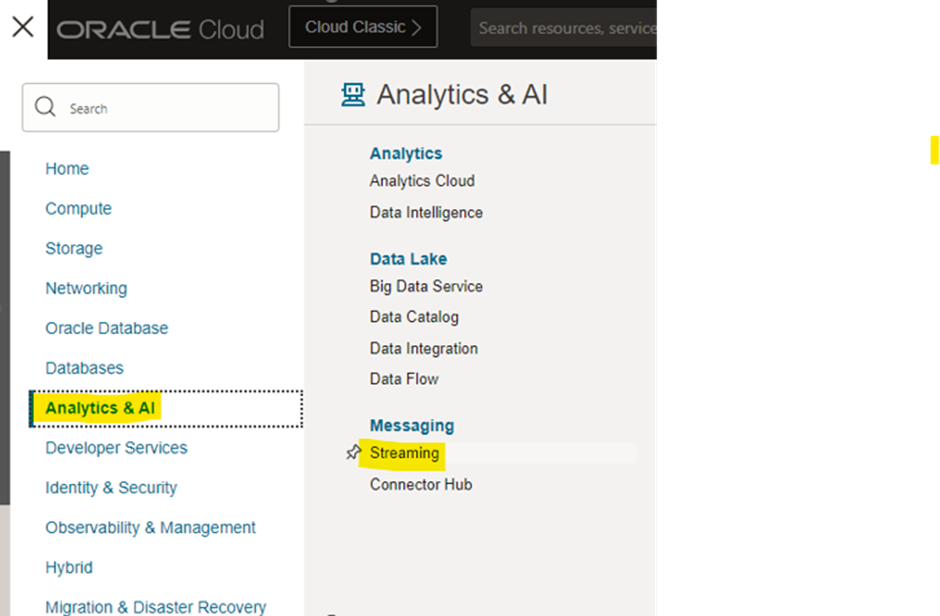
- Go to Menu → Analytics & AI → Streaming.
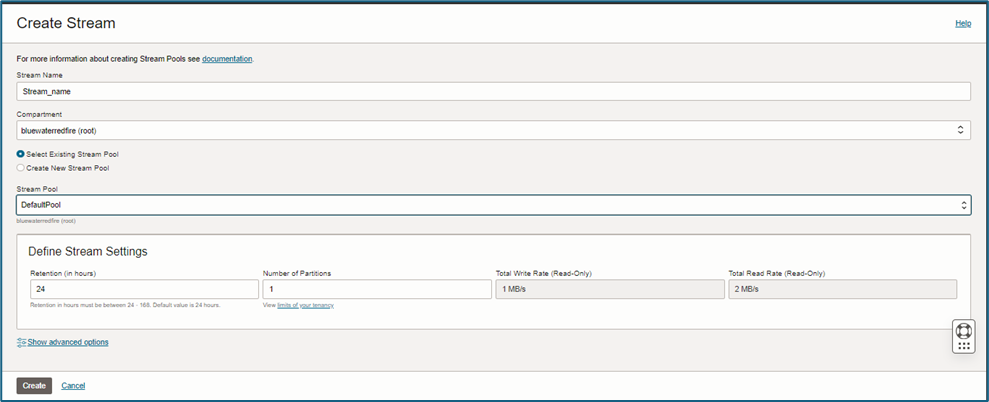
3. Create Stream.
- Stream Name – Provide a custom stream name.
- Compartment – Select the compartment with sufficient permissions to create a stream. (For this example, we used the default compartment.)
Note: Selecting the correct compartment is crucial to avoid any issues in stream operations.
- Auto-create the Stream Pool – Choose an existing stream pool (for testing) or customize it based on your specific needs.
Step 2: Configure the Logging Service
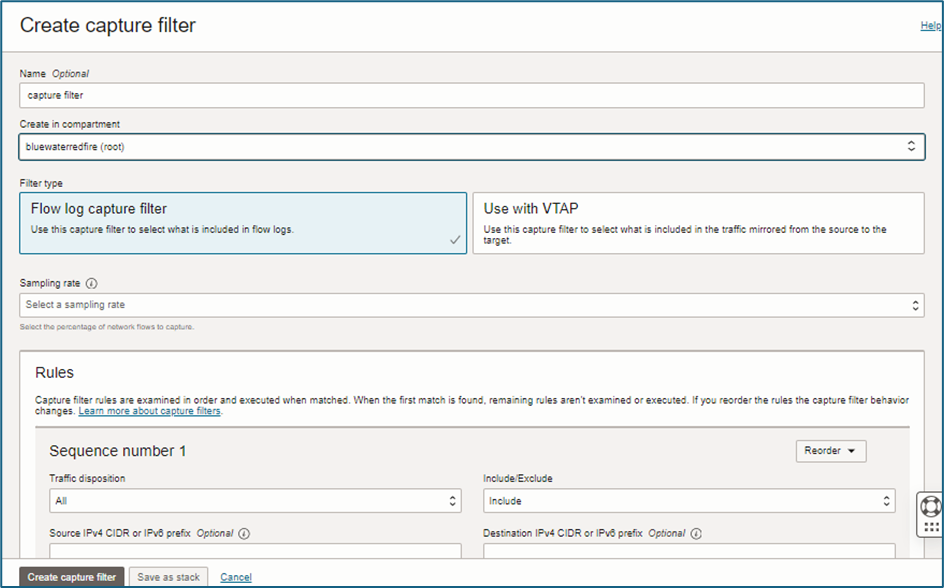
1. Create a Capture Filter to filter only the necessary logs.
- Go to Networking → Networking Command Centre → Capture Filter.
- Provide a Name for the Capture Filter.
- Select the Compartment.
- Choose the Filter Type as per requirements.
- Sampling Rate – Determines the percentage of logs captured and forwarded (e.g., 1%, 5%). For audit logs, 100% is recommended.
- Click Create Capture Filter.
- Once the filter is created, attach it to the corresponding log route to ensure that only filtered logs are transmitted to the stream.
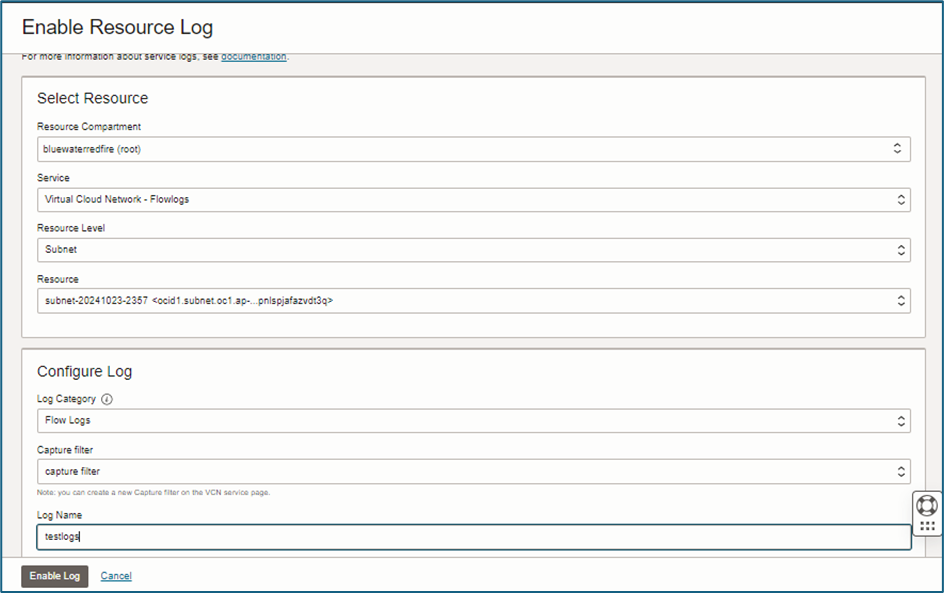
- Navigate to Logs → Enable Service Log.
We configure VCN Flow Logs for this example, but you can select other logs (e.g., audit logs, service logs) based on your use case.
Note: Before enabling the Resource Log, ensure that the Compartment contains active VMs or other resources capable of generating logs. Without resources, no logs will be captured.
- Select the Resource Compartment that contains the Stream.
- Service – Choose the type of log source.
- Resource Level, Resource – Set based on the selected service.
- Log Category – Choose the appropriate log category.
- Select the Capture Filter to apply.
- Provide a Log Name and click Enable Log.
- Review and save the configuration.
Step 3: Create a Service Connector
To stream logs from OCI to Splunk, create a Service Connector that facilitates this transfer from logging to streaming.
- In the OCI Console, navigate to Menu → Analytics & AI → Connector Hub.
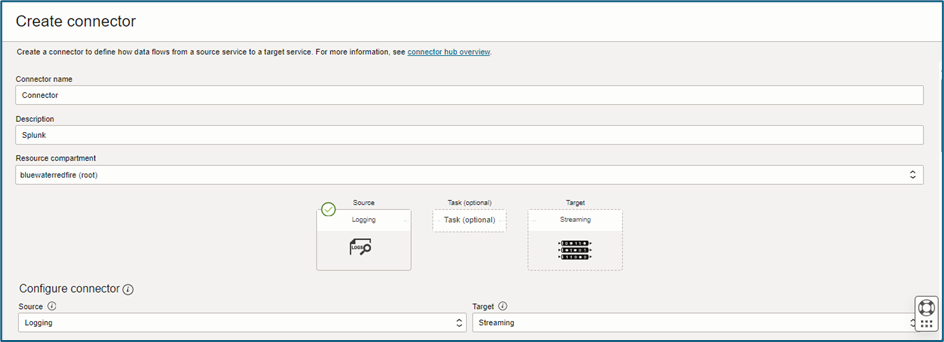
- Click on Create Connector.
3. Fill in the following details:
- Name: Provide a unique name for the connector.
- Description: Add a brief description to explain the purpose of the connector.
- Source: Select Logging as the source.
- Target: Select Streaming as the target.
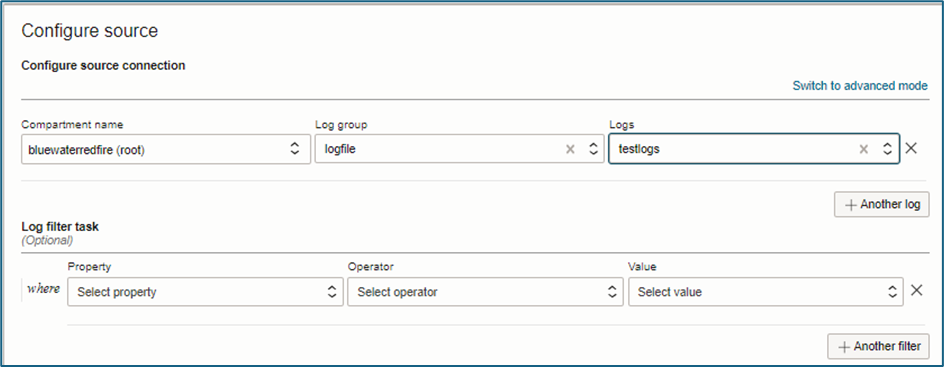
- Configure Correct Source: Select the Compartment, Log Groups, and specific Logs that you want to stream to Splunk. This step ensures you are only capturing relevant log data.
- Configure the Target Settings: Select the compartment and stream you created earlier.
- Toggle the Enable Logs button (select log category, compartment, log group).
- Finally, press Create to establish the service connector. This action will ensure proper authorization within the selected compartment.
If you do not have an inclusive IAM policy, you will see the following message:
To solve this, click the Create button on the popup, which will create the policy automatically.
Note: Now, click Create again to finalize the Connector.
Verify the Connector
To confirm that the service connector is functioning correctly:
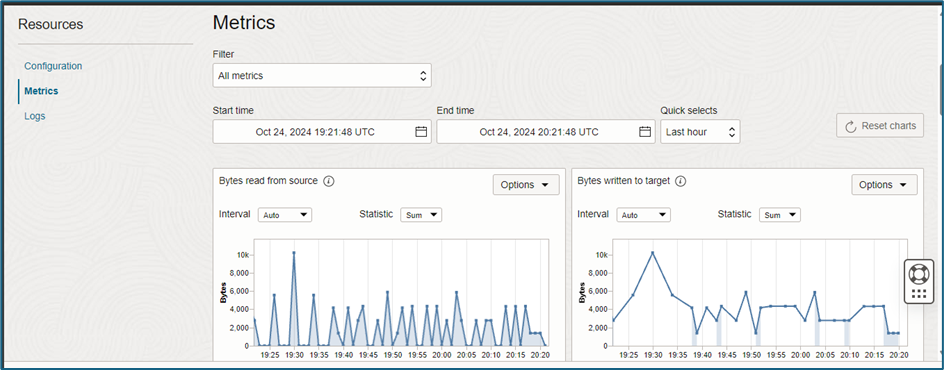
- Go to Connector Hub → Connectors and select your custom connector.
- The Resources tab must show Metrics, and logs should start appearing in the Streaming Service.
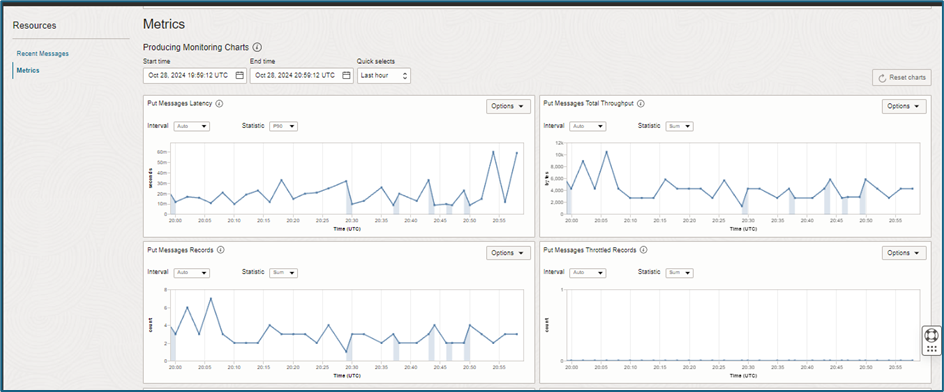
3. Navigate to Home → Streaming → Stream Details and verify that the stream has a metrics graph.
Step 4: Access Control (We Have Used API Key Method for Splunk On-Prem)
The OCI Logging Add-on for Splunk supports two access methods: Instance Principals and API Signing Keys.
Recommended Method: Instance Principals
- Instance Principals – Used when the Splunk instance is running on the OCI platform.
- This method is preferred as it eliminates the need to store long-lived tokens, providing a more secure access mechanism.
Alternative Method: API Signing Keys
- If you are not using Instance Principals, you can opt for API Signing Keys.
- These require additional management and should be secured properly.
Access Control Policies
Regardless of the method chosen, it is important to define a least-privilege policy to limit access. Oracle provides example policies for each method.
Instance-Principal Access Method (Requires Splunk Instance on OCI)
If using the Instance-Principal access method, follow these steps to configure access for the Splunk instance on OCI:
1. Create a Dynamic Group
- Group the Splunk instance as a principal actor to enable API calls.
- Define rules to specify group members based on compartment or other criteria.
- Follow the instructions here: Managing Dynamic Groups.
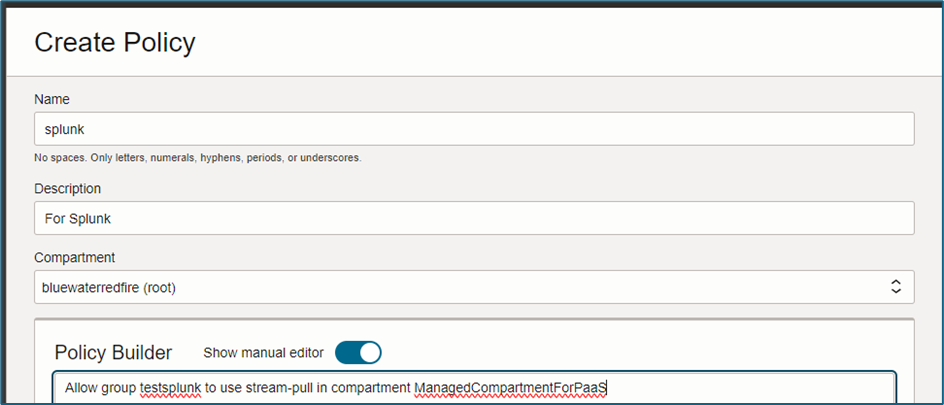
2. Create a Policy
- Name: Provide a custom name.
- Description: Add a relevant description.
- Compartment: Use the same compartment as before.
- Example Policy:
Allow dynamic-group <Splunk_Dynamic_Group> to use stream-pull in compartment <compartment_of_stream>
<Splunk_Dynamic_Group>refers to the dynamic group created, and<compartment_of_stream>is the sub-compartment under the mentioned compartment.- This policy grants the dynamic group permission to pull streams within the designated compartment.
3. Tagging Resources
- Use tags to organize and categorize resources based on business needs.
- Tags can be applied during resource creation or added later.
4. Additional Notes
- Administrator access is required to manage dynamic groups.
- The dynamic group name must be unique within your tenancy. The name is permanent and used as an identifier.
API Signing Key Access Method (Compatible with Any Splunk Instance)
If your Splunk instance is not running on OCI, use the API Signing Key method to grant access. Follow these steps:
1. Create an OCI User
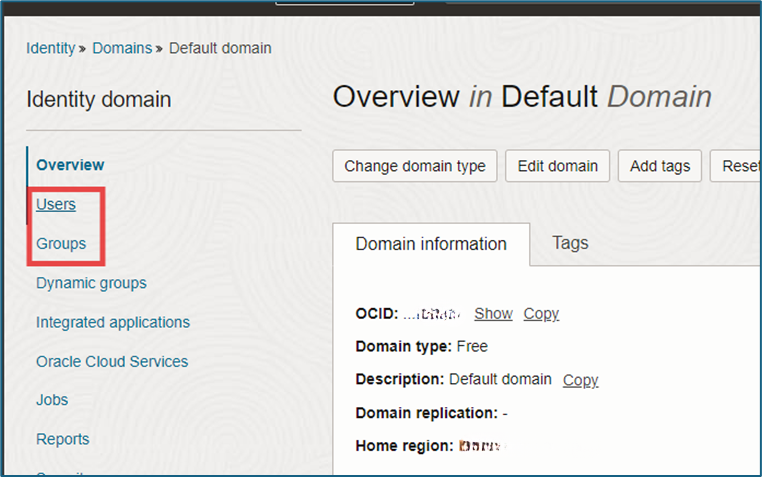
- Navigate to Menu → Identity & Security → Domain.
- Select Users → Create User.
- For detailed instructions, refer to Managing OCI Users.
- Example: We created a user called OCIUser.
2. Create an OCI Group and Add the User
- Go to Menu → Identity & Security → Domain → Groups → Create Group.
- Add the newly created user (OCIUser) to this group.
- Refer to Managing Groups for additional guidance.
3. Generate an API Signing Key
- For step-by-step instructions, visit Creating an API Signing Key.
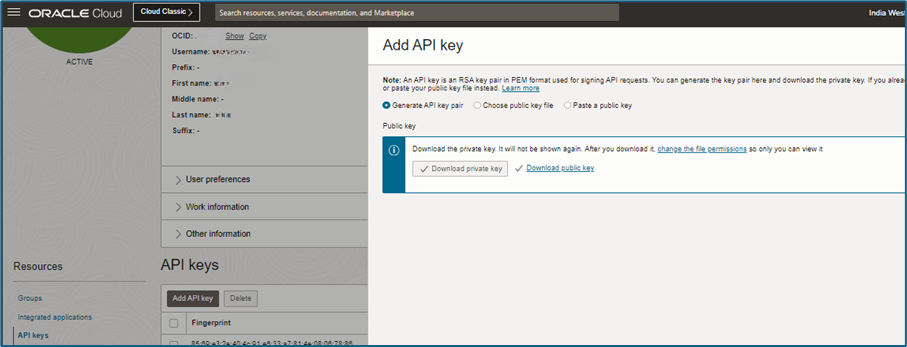
- In the OCI Console, navigate to Domain, select the user, then go to API Keys under the Resources menu on the left.
- Click Add API Key, then download the Public Key and Private Key.
- The downloaded Public Key needs to be uploaded to the user interface again. You can choose any of the following methods:
- Choose Public Key: Select this option and upload the recently downloaded public key.
- Paste Public Key: Copy the public key content and paste it into the designated box.
- Use CLI: Add the API public key using the OCI CLI. Refer to Managing Credentials for detailed instructions.
- The downloaded Private Key will be used later for configuring the Splunk Add-on.
4. Create an OCI IAM Policy for Access
Define a policy to grant the group access to pull streams.
- Name: Custom name
- Description: Provide a brief description
- Compartment: The compartment used for streaming
- Example Policy:
Allow group <Splunk_User_Group> to use stream-pull in compartment <compartment_of_stream>.
<Splunk_User_Group>refers to the OCI group created earlier.<compartment_of_stream>is the sub-compartment of the specified compartment (incorrect configuration may lead to policy errors).
- In the OCI Console, navigate to Identity & Security → Policies.
- Select the compartment where the stream exists and click Create Policy.
Step 5: Collecting Data for Splunk Connection
To set up data collection from OCI to Splunk, gather the following details and configurations:
Stream OCID and Endpoint
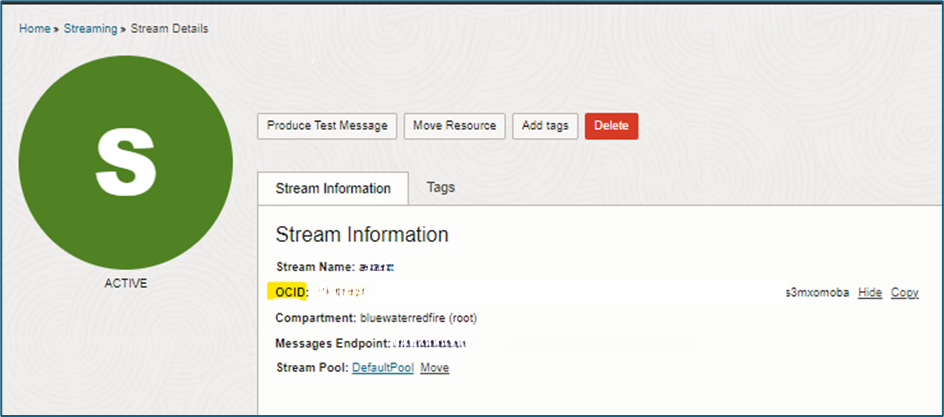
- Stream OCID
- Navigate to Home → Streaming → Stream Details.
- Under Stream Details, copy the Stream OCID.
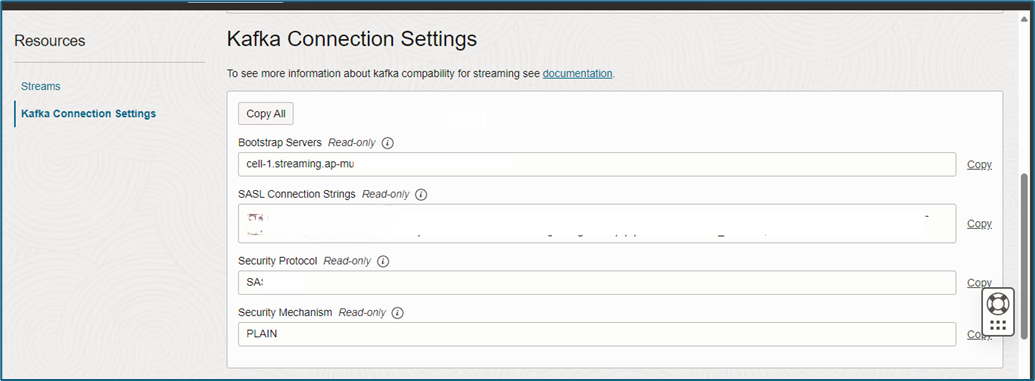
2. Stream Endpoint
- Navigate to Stream → Streaming Pool Details → Kafka Connection Settings.
- Under Bootstrap Servers, copy the FQDN (e.g.,
cell-1.streaming.{OCI-Region}.oci.oraclecloud.com). - Important: When pasting the FQDN into the Splunk connection, remove port 9092 to ensure proper configuration.
3. OCI Region
- Specify your OCI region (e.g.,
eu-frankfurt-1).
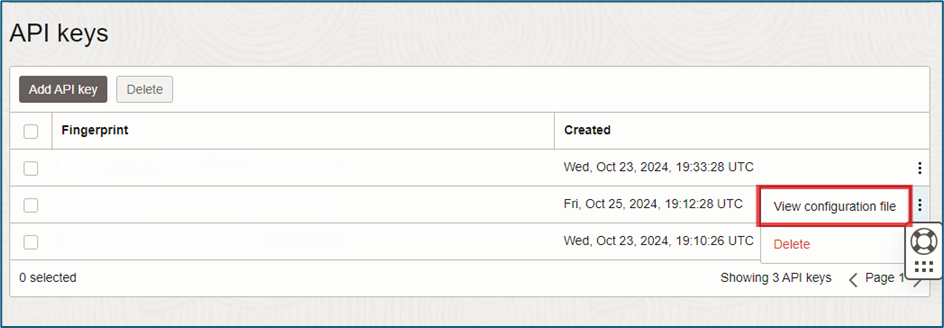
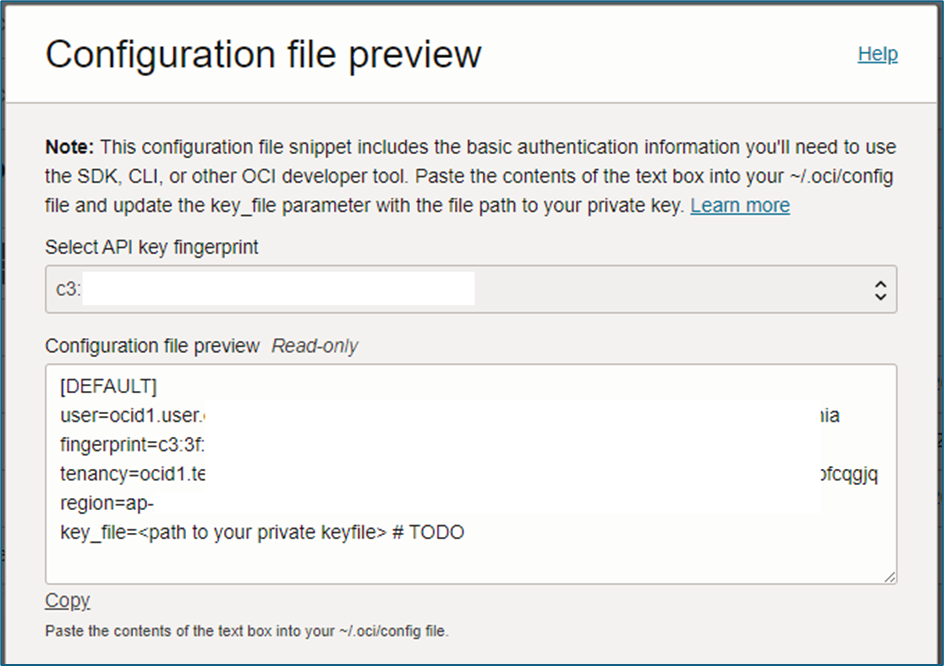
Note: All OCIDs can be accessed by selecting “View Configuration File” on the created user.
- In the OCI Console, navigate to Domain → Select User → API Keys under the Resource Menu.
- Open the configuration file for your key.
- Tenancy OCID – Unique identifier for the tenancy, found in the Configuration file (e.g.,
ocid1.tenancy.oc1.....). - User OCID – Unique identifier for the user linked to the API key, found in the Configuration file (e.g.,
ocid1.user.oc1...). - Fingerprint – Fingerprint of the API Key (e.g.,
aa:aa:aa:aa:aa:ae:aa:aa:aa:aa:aa:aa:ac:aa:aa:aa).
Configuring OCI Add-on for Splunk in HF
OCI Logging Configuration in Splunk
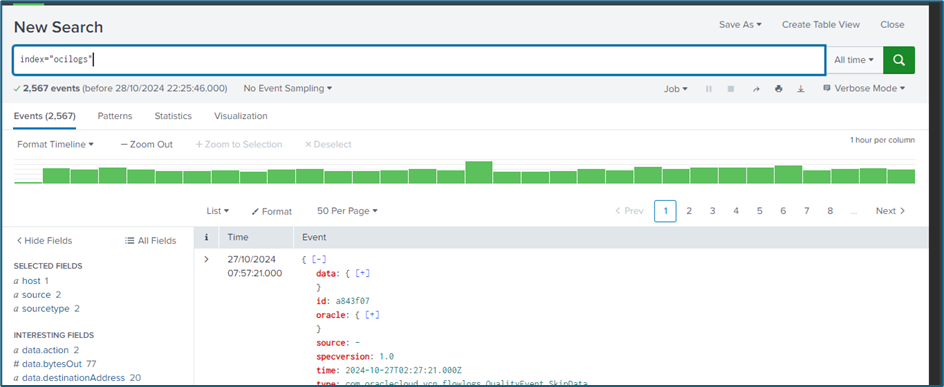
Ensure that the OCI Logging Add-on for Splunk is installed on the Heavy Forwarder and is correctly receiving logs from OCI. Download the latest add-on from the OCI GitHub Repository.
Creating Indexes on Indexers
- Primary Index:
ocilogs(For OCI logs storage; you can use any custom name) - Summary Index:
oci_vcn_summary(Used for VCN Flow Logs; all VCN dashboards rely on this summary index)
Saving the OCI API Private Key
Save the private key created earlier to the following location on the Splunk Heavy Forwarder:
Setting Permissions for key.pem
Run the following command to restrict permissions on the private key file:
- Private Key Passphrase: Set the passphrase, if applicable.
Configuring Data Input in Splunk
- In the Splunk UI, go to Settings → Data Inputs.
- Input Name – Provide a custom name for this input.
- Select OCI Logging from the list of available data inputs.
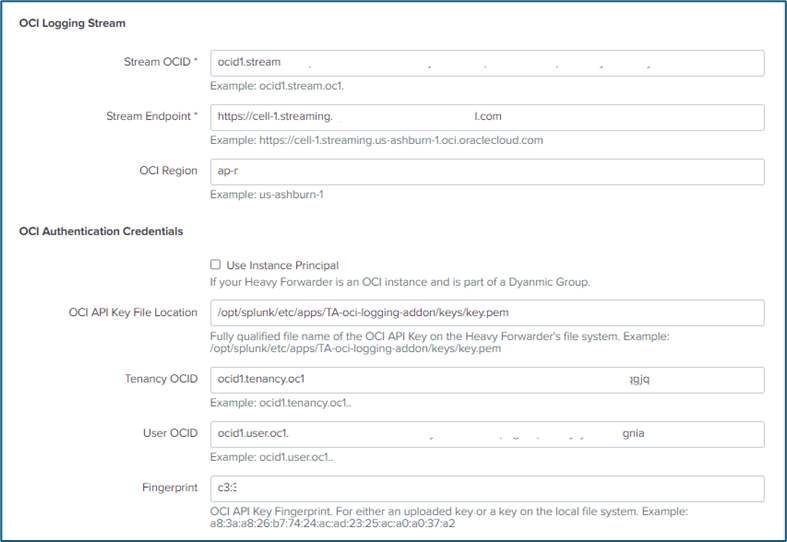
- Follow the prompts to configure the connection details, including:
- Stream Endpoint
- Tenancy OCID
- User OCID
- API Key
- Other credentials collected in the previous steps.
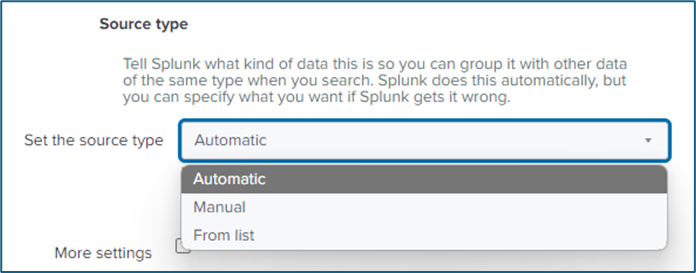
- Manual – Enter the exact sourcetype name manually.
- Automatic – The sourcetype is determined automatically.
- From List – Choose from existing sourcetypes in the Splunk instance.
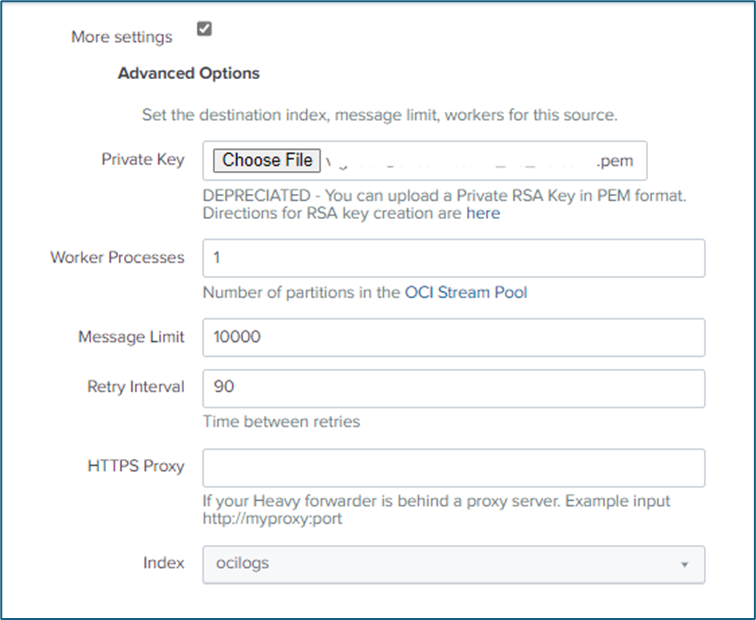
6. Additional Settings
- Upload Private Key – Attach the previously generated private key for authentication.
- Worker Processes – Keep the default setting unless specific performance tuning is needed.
- Message Limit – Sets a cap on messages per batch to control throughput and prevent overloading.
- Retry Interval – Defines the waiting time before retrying failed messages.
- Select Index – Choose the primary index created earlier for storing OCI logs.
7. Save the Configuration
After completing all the steps, save the configuration to activate data ingestion from OCI into Splunk.
Once saved, logs from OCI should start streaming into the designated Splunk index, allowing further analysis and monitoring.
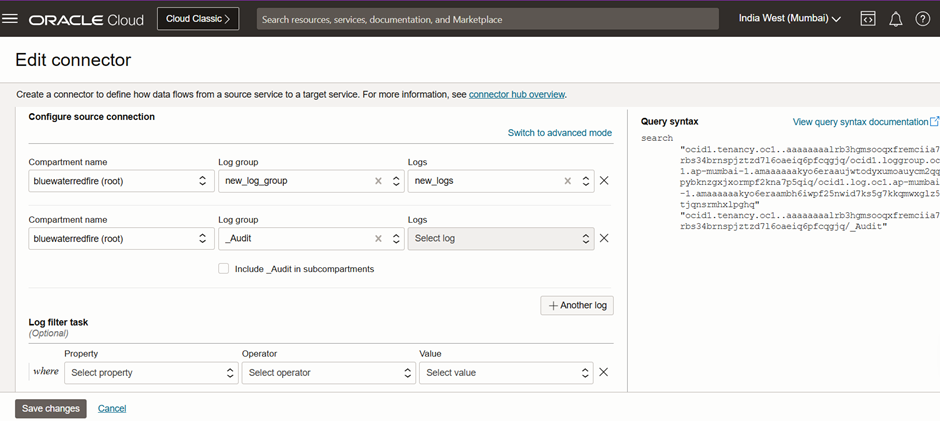
Configuring Audit Logs in OCI Connector
By default, the _audit log group is created in OCI for audit logs. To ensure audit logs are included in the Splunk ingestion process:
- Navigate to your OCI Connector.
- In the Source section, add an additional entry for _audit logs.
- Save the configuration to start collecting audit logs in Splunk.
This allows Splunk to ingest and analyze audit logs along with other OCI log sources.
For reference, check the detailed guide here.

