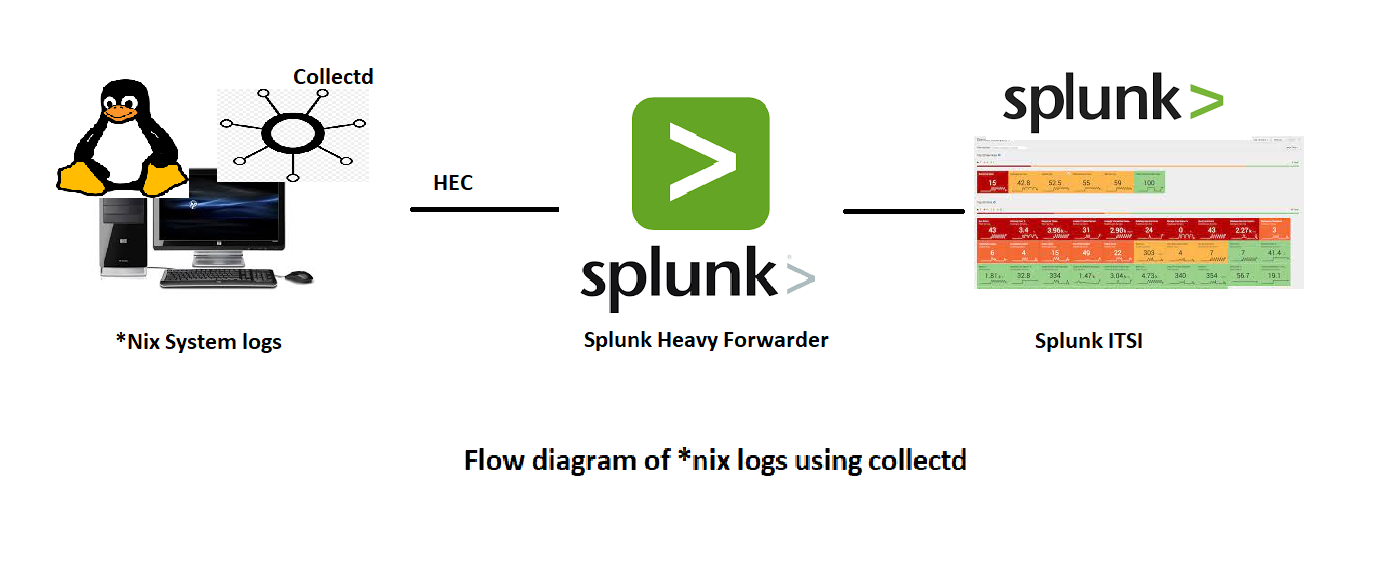
This post focus on collecting *nix data from the system using Collectd
But first let us discuss about the collectd and HEC which are being used for collecting data.
About Collectd :
Collectd is an unix deamon tool that gathers metrics and timeseries data of computers and network equipment. Why Collectd?
- Free/open source software : It is part MIT/part GPL licensed
- Platfom independent : linux ,BSD,Solaris
- Agent based Design : It runs on each host
- More than 90 plugins : System metric (eg network interfaces), Application metrics (eg Memcached) and more
About HEC :
HEC is a HTTP Event collector which allows clients to send event data directly to the splunk enterprise or splunk cloud for indexing via http/https. It is a light weight application which is suitable to work for mobile apps,IOT devices etc
In these blog posts we are setting up HEC on splunk instance, create an authentication token and use it to send events from our devices to splunk instance for indexing as shown below
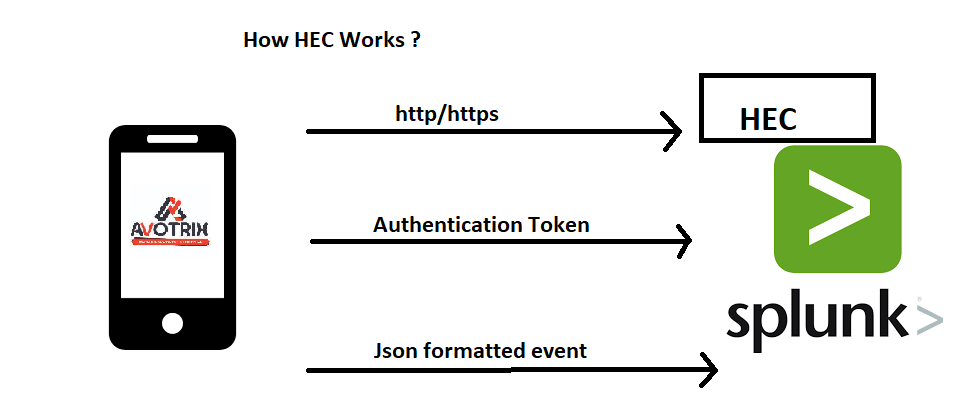
For eg as shown above, Our app sends an http post request to the collector endpoint which includes authentication token and json formatted event details to the indexer
Configure the HTTP Event Collector (HEC) data input
(Here we have used Heavy Forwarder UI to configure the same)
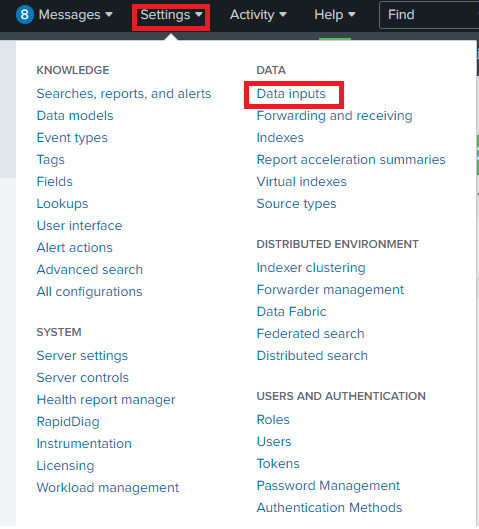
- In Splunk Web, click Settings > Data Inputs.
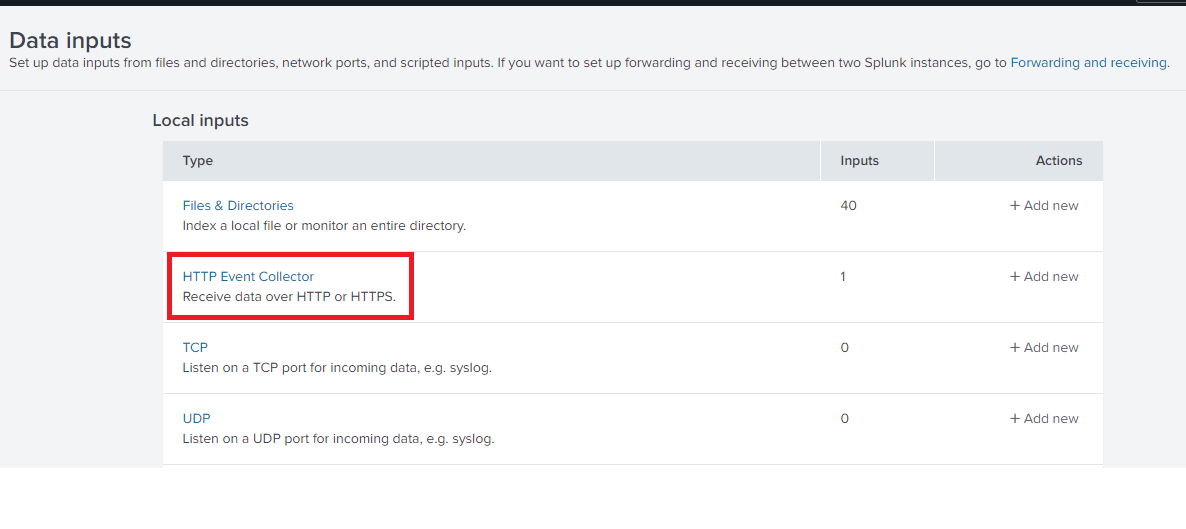
2. Under Local Inputs, click HTTP Event Collector.
3. To verify HEC is enabled proceed as shown in the image below :
- Click Global Settings.
- For All Tokens, click Enabled if this button is not already selected.
- Note the value for HTTP Port Number, which you’ll need to configure collectd.
- Click Save.

4 . Configure an HEC token for sending data by clicking New Token.

5. On the Select Sourcepage, for Name, enter a token name, for example “collectd”.Leave the other options blank or unselected.Click Next.
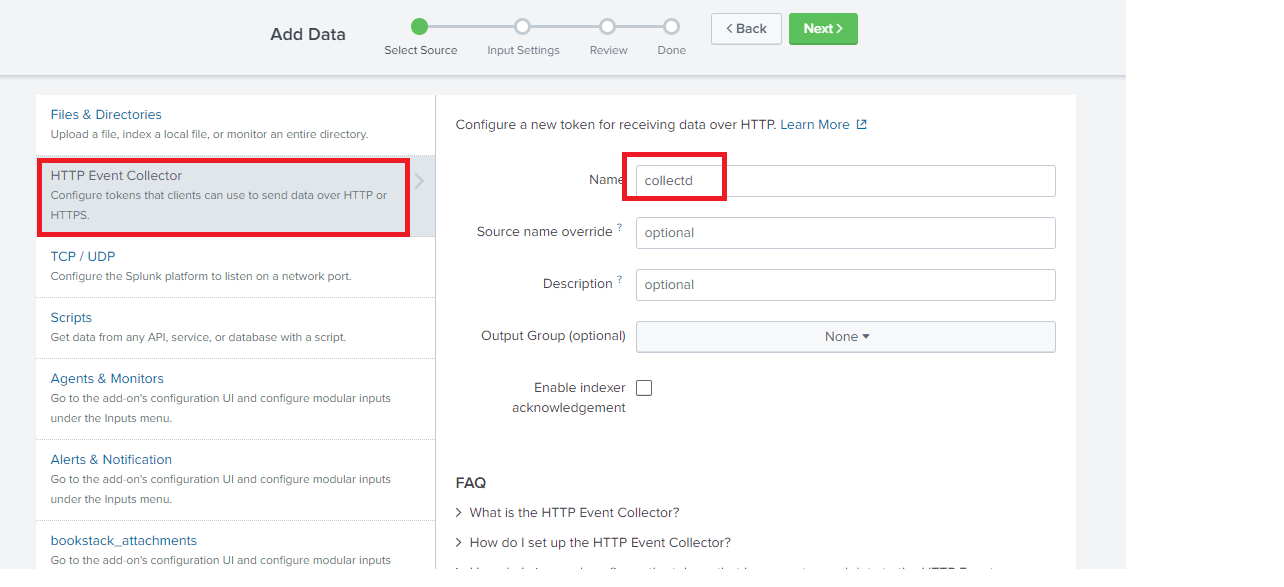
6. On the Input Settingspage, for Source type, click Select.
Click Select Source Type, then select itsi_im_metrics.
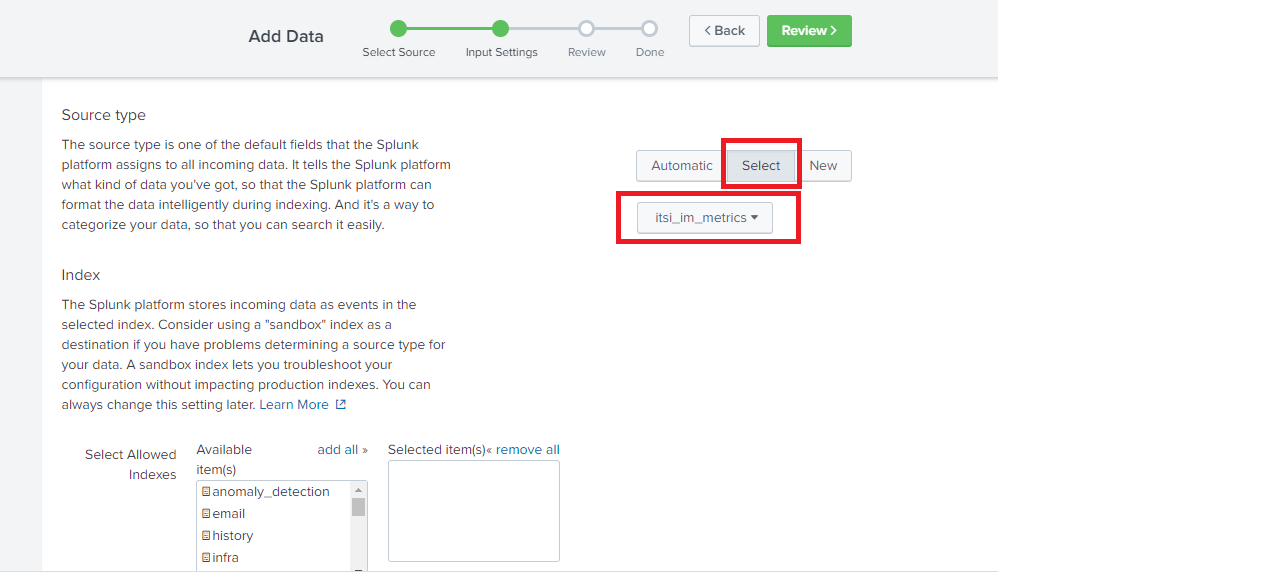
7. Next to Default Index, select your metrics index or click Create a new index to create one.
8. Copy the Token Valuethat is displayed, which you’ll need to configure collectd.

Follow these steps to configure and use the data collection script to collect *nix metrics and logs in ITSI.
- From the ITSI main menu, go to Configuration > Data Integrations.
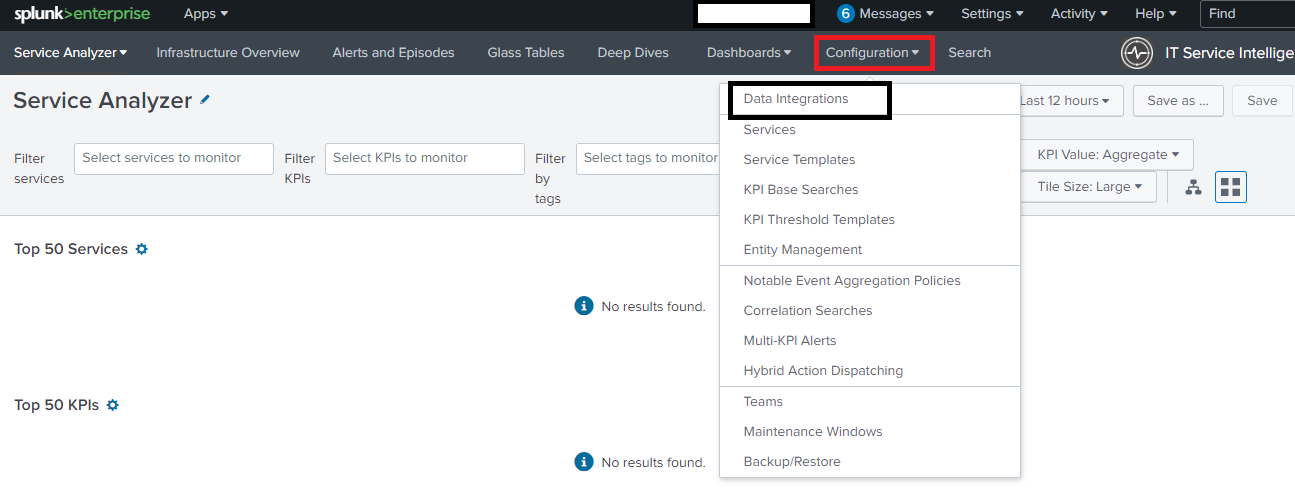
2. Select the Unix and Linux chicklet

3. Select Collectd.
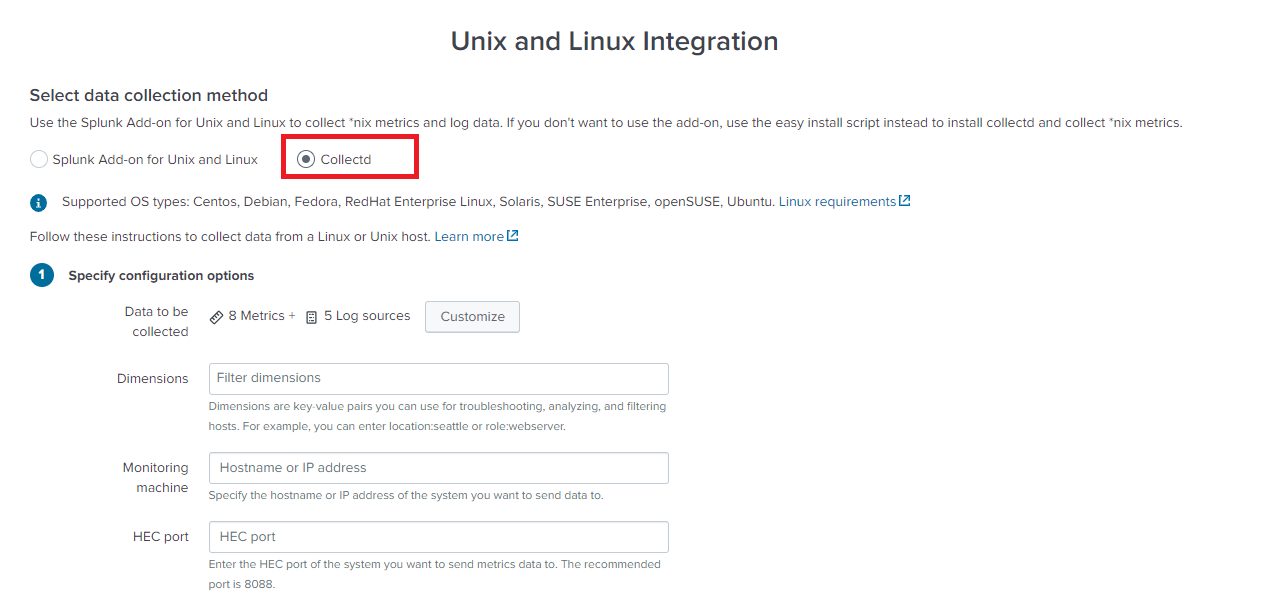
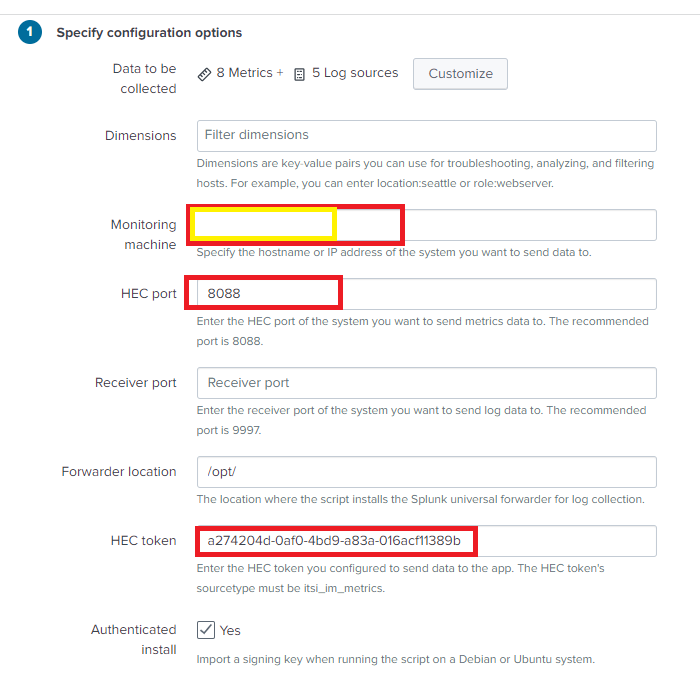
4. Enter the following parameter
- Enter the Monitoring machine hostname or IP address of the Splunk Enterprise instance you want to send metrics and log data to.
- For HEC port, enter the port you use for the HTTP Event Collector (HEC) on the Splunk Enterprise instance you want to send metrics data to.
- For HEC token enter the value of the HEC token you configured to receive metrics data for ITSI entities.
Copy the script
This script is used on your host to collect metrics and logs.
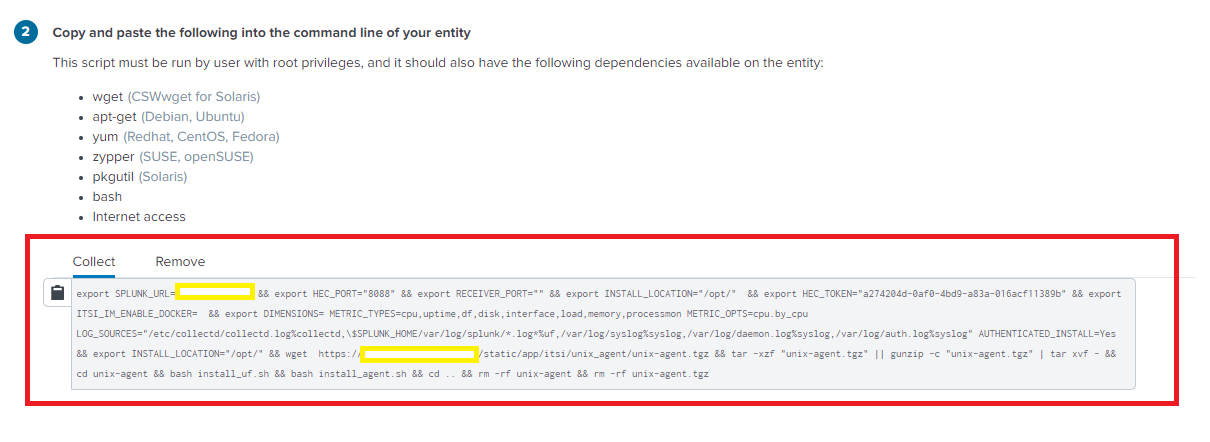
Remove the “bash install_uf.sh” from the script, if you don’t want to install the UF on your instance.
Install and configure collectd on host instance
- Log in as Root user.
- Paste the script copied above
export SPLUNK_URL=<monitor machine hostname>&& export HEC_PORT="8088" && export RECEIVER_PORT="" && export INSTALL_LOCATION="/opt/" && export HEC_TOKEN="a274204d-0af0-4bd9-a83a-016acf11389b" && export ITSI_IM_ENABLE_DOCKER= && export DIMENSIONS= METRIC_TYPES=cpu,uptime,df,disk,interface,load,memory,processmon METRIC_OPTS=cpu.by_cpu LOG_SOURCES="/etc/collectd/collectd.log%collectd,\$SPLUNK_HOME/var/log/splunk/*.log*%uf,/var/log/syslog%syslog,/var/log/daemon.log%syslog,/var/log/auth.log%syslog" AUTHENTICATED_INSTALL=No && export INSTALL_LOCATION="/opt/" && wget https://prod-itsi.avotrix.in:/static/app/itsi/unix_agent/unix-agent.tgz && tar -xzf "unix-agent.tgz" || gunzip -c "unix-agent.tgz" | tar xvf - && cd unix-agent && bash install_agent.sh && cd .. && rm -rf unix-agent && rm -rf unix-agent.tgz
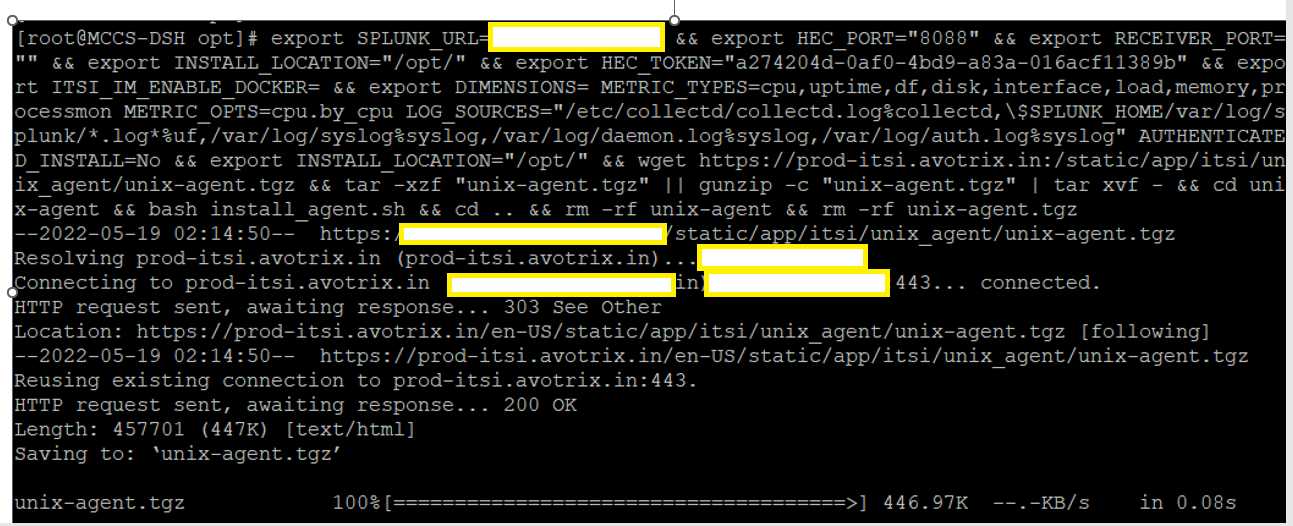
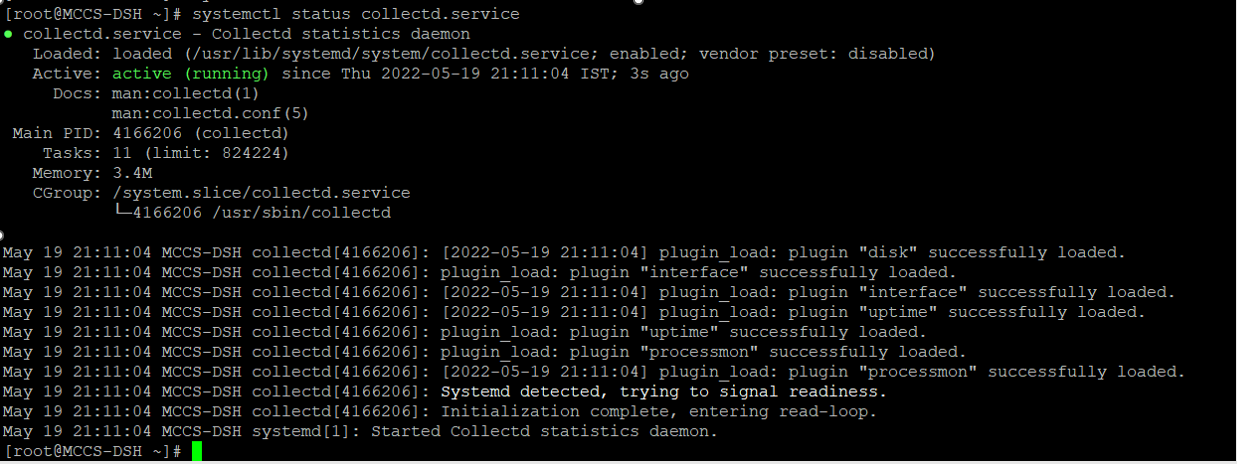
3. Check the status
systemctl status collectd.service

If you see the processmon error.Go to file collectd.conf
vi /etc/collectd.conf
Change SSL false in the plugin write_splunk stanza as shown in the image below

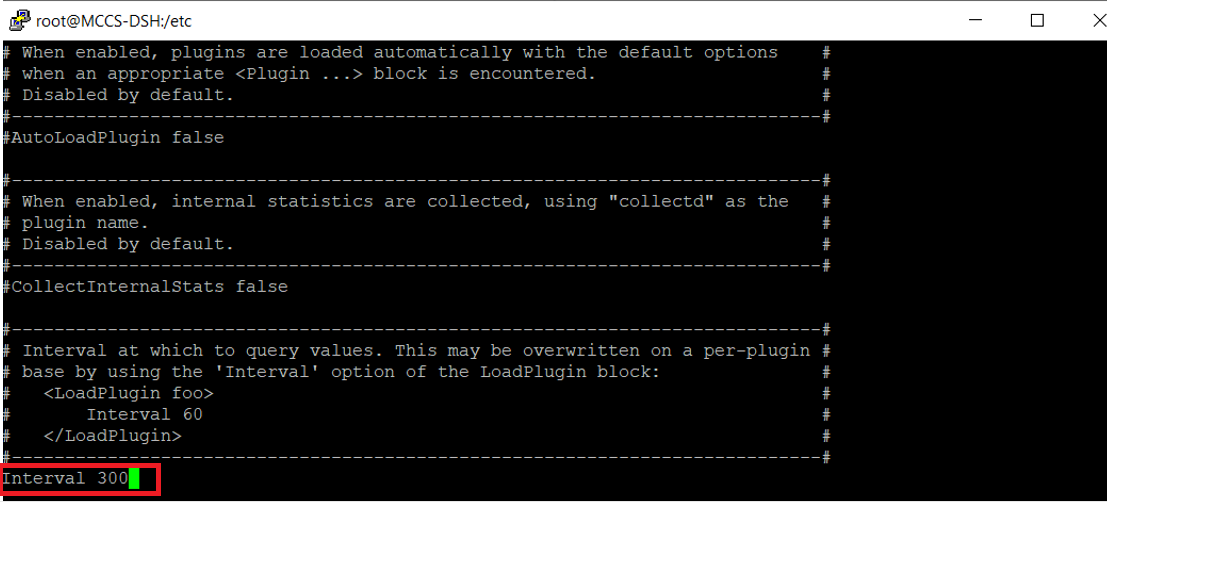
By default, the interval is 60. If you think it sends the lots of data, you can change the interval to 300.
4. Now restart the collectd and check the status
systemctl restart collectd.service
systemctl status collectd.service
Verify your Hosts
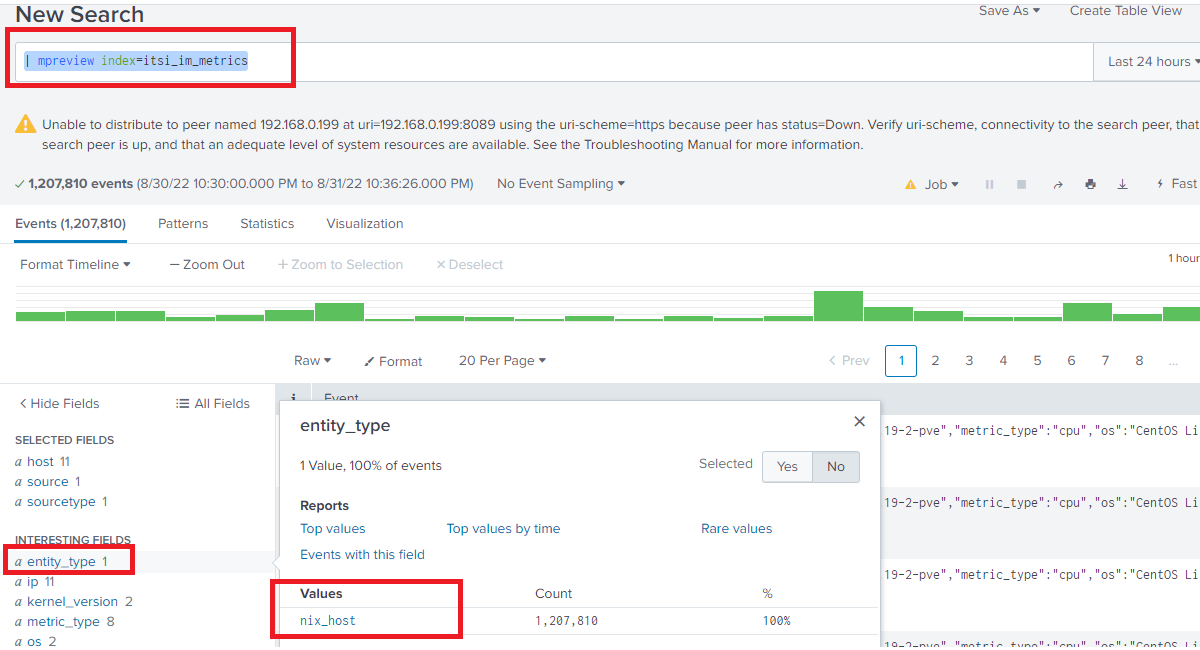
Check to see if the data is coming into the host
| mpreview index=itsi_im_metrics
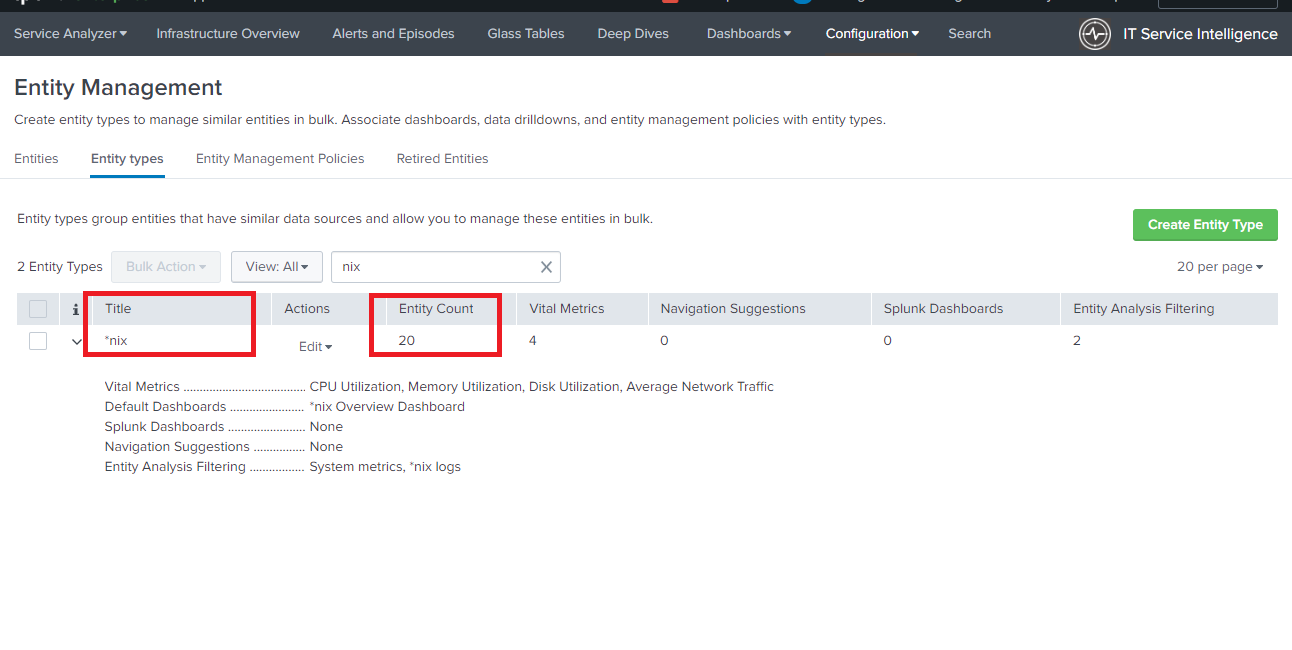
You can also check your host in the ITSI user interface
Goto Configuration > Entity Managment >Entity Types
You can see l the host count under the title *nix as shown below
If you still have any doubt regarding collecting nix logs using collectd, Feel free to Ask your Doubts in the Comment Section below ,give your ratings and Don’t Forget to Follow us on 👍 Social Networks.| Happy Splunking 😉


