
“How Do We Manage All This Splunk Instances at a single point?” “What Is The Usage Of My Splunk License On Daily Basics?” OR “Is My Splunk Environment In Good Health?” distributed management console splunk will help you here is how:
There will be many questions that can come into your mind when you are an admin of a Splunk infrastructure. It is difficult for an admin or developer to track the health of Splunk environment when it comes to distributed environment. Health check that means maintaining all aspects of functionalities for Buckets (Hot, Cold, Frozen), Data Usage, License Expiry, Forwarders , indexer and searchhead cluster and all other nodes of your environment.
So here what Splunk has got us ‘DMC – Distributed Management Console’
The Distributed Management Console or DMC is a feature introduced in Splunk that allows you to monitor your Splunk Deployment by providing real-time monitoring and performance reporting from a central search head via eight different dashboards. This Blog will guide you with all the steps & best practices that will be helpful for installation and setting up DMC into Splunk environment. It’s always better to know all the prerequisite before you configure it in your environment or else it might prompt you with errors in future.
Where to Configure distributed management console splunk????
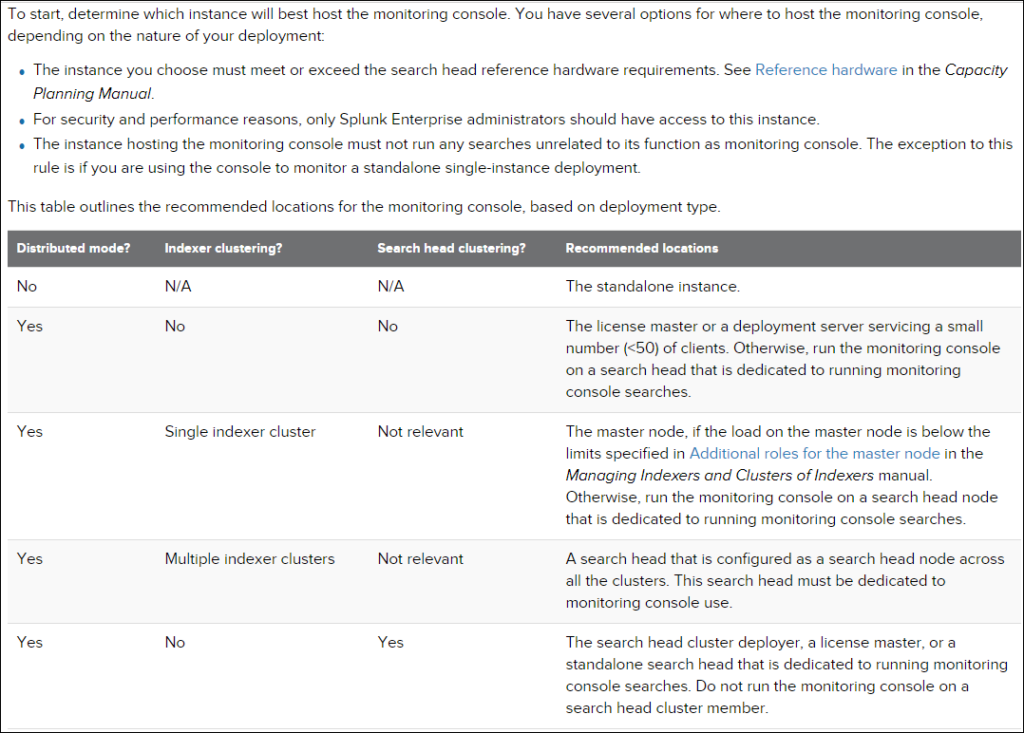
Never install on production Searchhead->>
- Non-Monitoring console searches that run on production Searchhead might have incomplete result
- All production Searchhead should be monitored for performance and monitoring console affect the performance of Searchhead that host it.
From where monitoring console gets data???
- Internal logs from $SPLUNK_HOME/var/log/splunk and $SPLUNK_HOME/var/log/introspection get forwarded to indexers from all components.
How to add all instances to get monitored??
Step 1: Log in to the instance to which monitoring console need to be configure (eg—174),
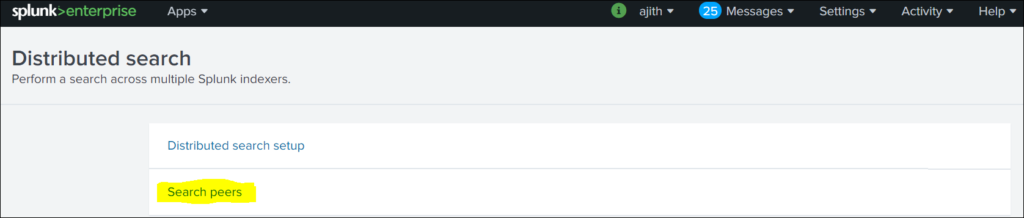
Go to settings >> Distributed Search

Step 2: Distributed Search >> Search Peers
Step 3: To add instances to be monitored
Search Peers>> New Search Peer
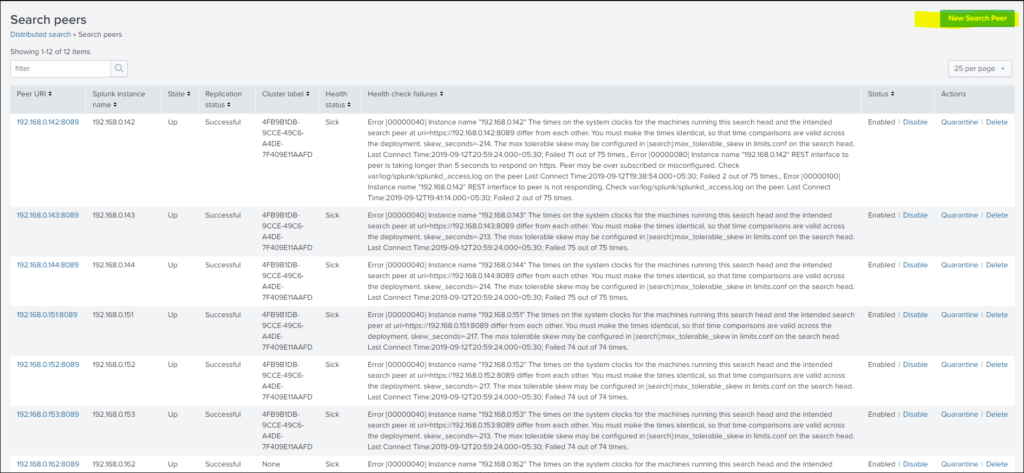
Step 4: Add details of Instance, with user ID and password for particular instance and save.
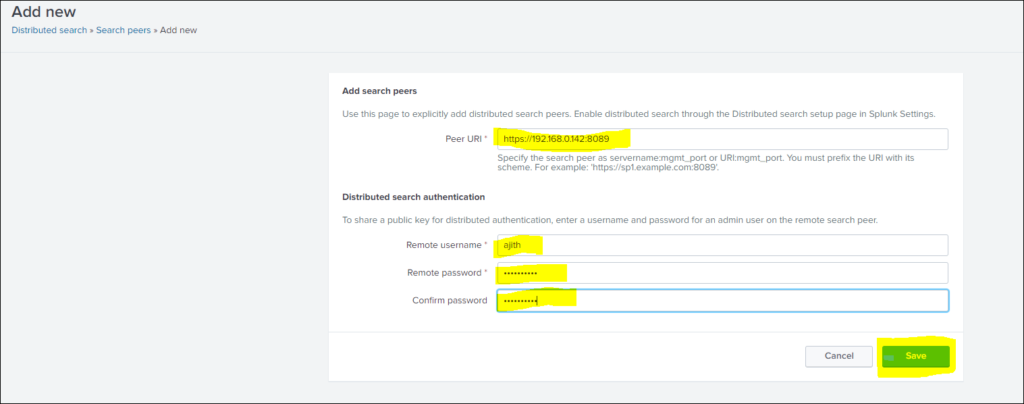
Step 5: Once instance get added it can be seen in Search Peer list, will be at initial status , very soon it will get to successful status, this way you can add all instances one by one.


How to configure monitoring console to monitor all added instances:
Step 1: Log in to the instance to which distributed management console splunk need to be configure (eg—174)
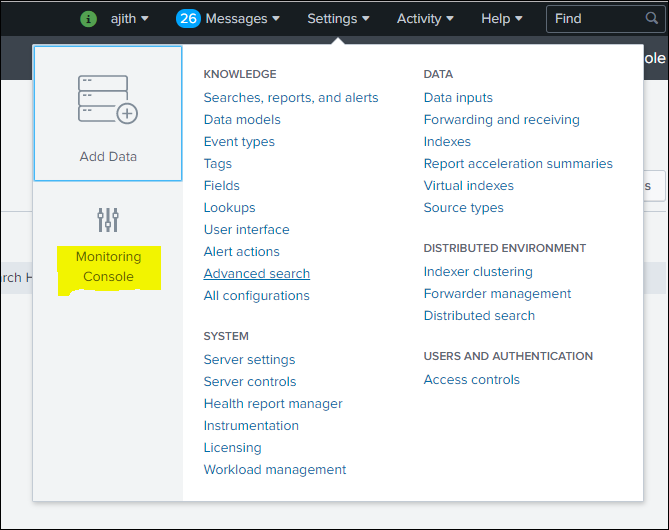
Go to settings>> Monitoring Console
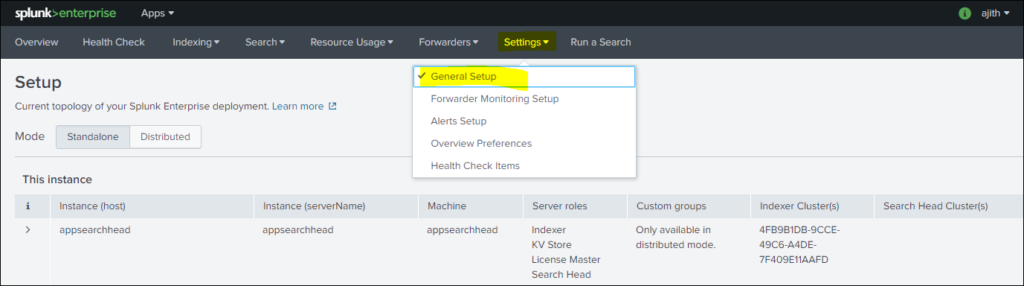
Step 2: Click Settings in monitoring console >> General Setup
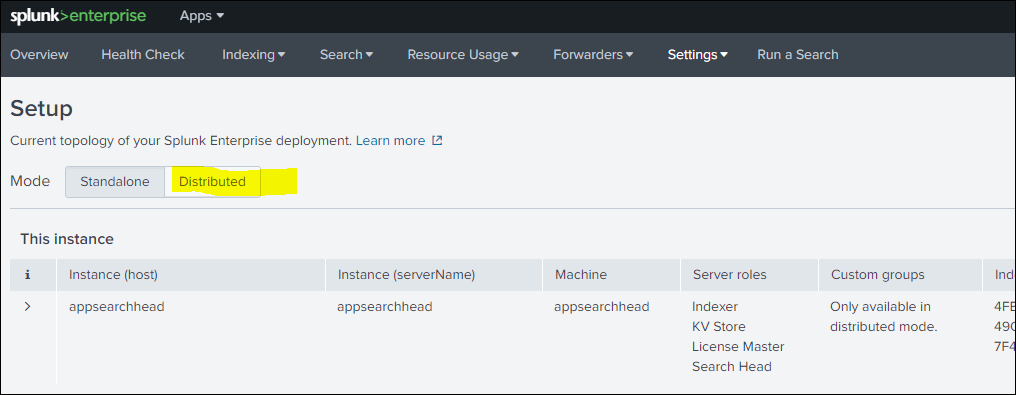
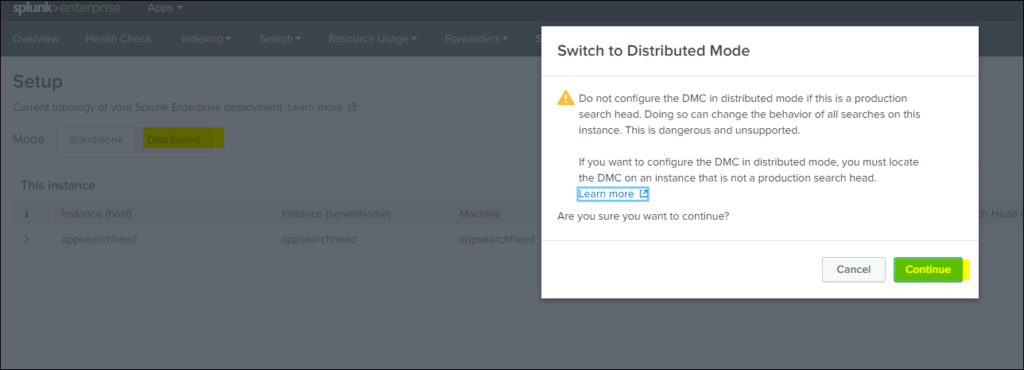
Step 3: Select distributed Mode and continue with selection and in process apply all changes as shown blow in three consecutive steps.
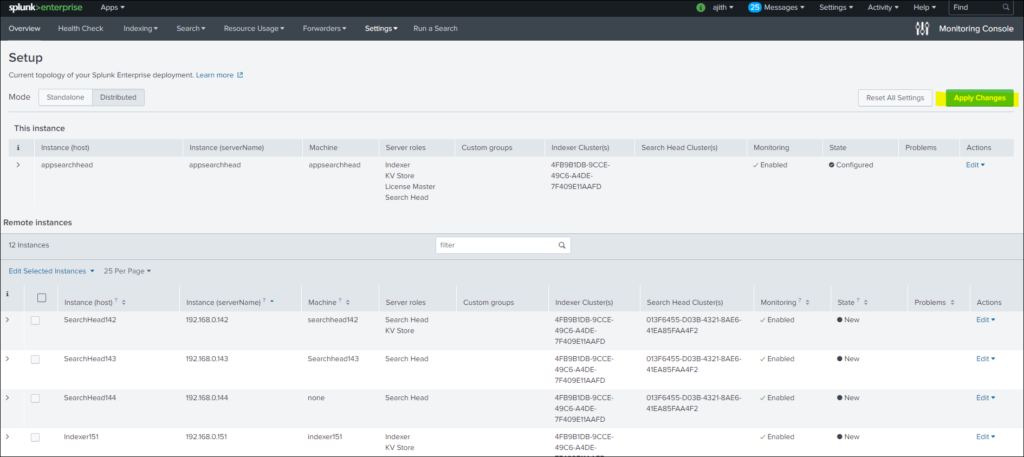
Files configuration while applying changes to set up monitoring console:
These files reside in $SPLUNK_HOME/etc/apps/splunk_monitoring_console/. This directory contains configuration files in both a default directory and, after Monitoring Console setup, a local directory.
| File(s) | Information contained in file(s) | When populated |
|---|---|---|
| app.conf | Basic information about the Monitoring Console: determines whether it is in distributed mode, and provides a short description for Splunk Web | By default. Updated when you click Apply changes. |
| distsearch.conf in etc/system/local | Contains stanzas that reference distributed search groups created by the Monitoring Console. The names of these groups are usually prefaced with dmc_group_*. For example: [distributedSearch:dmc_group_cluster_master] | When you switch to distributed mode in Monitoring Console setup and click Apply changes |
| dmc_alerts.conf | In some cases, you can edit thresholds in a platform alert without having to directly modify the search string for that alert. For such an alert, the Monitoring Console has a template of the search string, description string, and editable parameters. The template data, which is used in the Monitoring Console Alerts Setup page, is stored here, in stanzas named for the name of the saved search in default/savedsearches.conf. | By default |
| lookups directory | Contains two important files: assets.csv lists the instances that the Monitoring Console recognizes and their peer URI (unique name), server name, host, machine (host fqdn), search group (server role, custom group, or cluster). This csv is used by every Monitoring Console dashboard.dmc_forwarder_assets.csv is generated when you enable forwarder monitoring. Enabling forwarder monitoring enables the scheduled search (DMC Forwarder – Build Asset Table) in savedsearches.conf, which populates this .csv file. | By default (on initial start-up). Updated when you click Apply changes or Rebuild forwarder assets, respectively. |
| macros.conf | Contains two types of macros: Search macros for all Monitoring Console dashboards.Overview page customizations set in Monitoring Console > Settings > Overview preferences. | Search macros are stored here by default. Customizations are set when you edit one and click Save. |
| props.conf | Search-time field extraction and lookup applications and evals. | By default |
| savedsearches.conf | Schedules and search strings for platform alerts. The saved search named DMC Forwarder – Build Asset Table runs when you enable forwarder monitoring. | By default |
| splunk_monitoring_console_assets .conf | This file contains: A list of search peers configured with the Monitoring Console, and any for which you have disabled monitoring.Any search peer identifier that has been overwritten by the Monitoring Console manually during setup, for example host, host_fqdn, indexer cluster labels, or search head cluster labels.Stanzas describing which indexer and search head cluster(s) each search peer is a member of. | When you click “Apply Changes” on Setup > General setup |
Final dashboard Via DMC
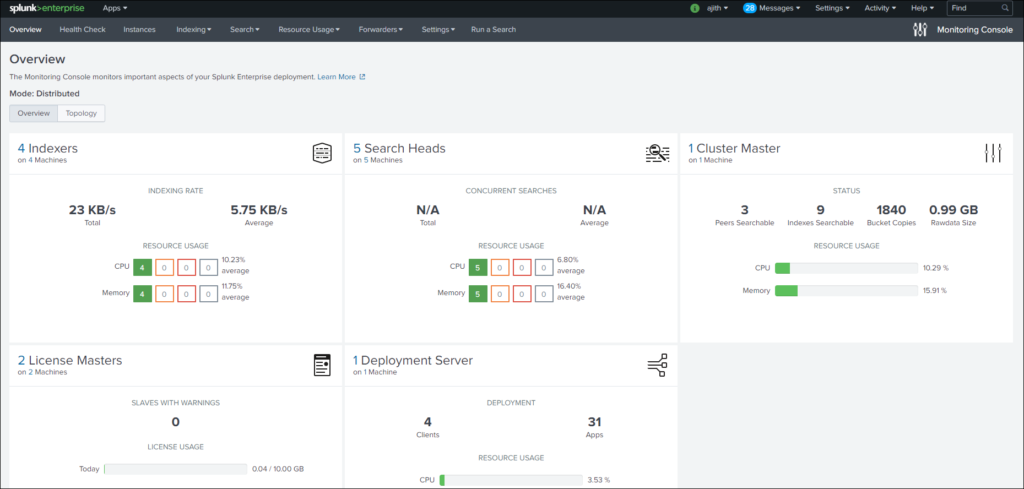

Here are some different scenarios where we can compare some of the dashboards
Example how to use dashboards provided through monitoring console: It can be explored more as per dashboards provided and task requirement
| Symptom | Dashboard |
|---|---|
| My users are reporting errors when they run a search, like “Peer x is unresponsive”, “Peer did not participate in search”, or “Results might be incomplete”. | Possible starting points include: Distributed search: Deployment health checks, or Distributed search: Instance if you know which search peer is experiencing the problems. On Resource usage: Deployment select search peers, and look for any that are oversubscribed. Compare problematic time periods in the Distributed search and Resource usage views to consider capacity planning. |
| My users’ UI is slow | Resource usage: Instance for the instance experiencing problems. |
| My search performance is slow | Resource usage: Deployment, Scheduler activity, or Search activity |
| Is my indexer/search head up/down right now? | Overview > Topology |
| Is indexer workload distributed evenly across instances? | Indexing performance: Deployment |
| What are my indexes’ retention policies? | Indexing > Indexes and Volumes: Instance |
| KV store is not initializing | Search > KV Store: Deployment |
| Splunk Web errors that disk space is full | Resource usage: Machine or Indexes and volumes dashboards |
Kindly Go To DMC installed in your distributed management console splunk environment and explore all the tabs given in monitoring console UI
Also distributed management console splunk provide us with Reports and Alerts that are helpful and can also save lot of your time.There are alerts for Disk Usage, Total License Usage, Memory Usage etc. So let’s get into more details step by step.
Manage Alert (Configure & Enable)
There are 8 platform alerts are available by default in the monitoring console (Abnormal State of Indexer Processor, Critical System Physical Memory Usage, Expired and Soon To Expire Licenses, Missing forwarders, Near Critical Disk Usage, Saturated Event-Processing Queues, Search Peer Not Responding, Total License Usage Near Daily Quota)
To view Alert result: Overview > Alerts > Managed triggered alerts.
Enable Alert: Overview>>Triggered Alerts > Enable or Disable.
Configure platform alerts and set alert actions:
You can view and configure the default settings and parameters for platform alerts, including the following:
- Alert thresholds, if applicable
- Alert schedule
- Suppression time
- Alert actions (such as sending an email or starting a custom script)
To change an alert threshold, perform the following steps:
- From the Monitoring Console, click Overview > Alerts > Enable or Disable.
- Find the alert you want to configure and click Edit.
- Edit the threshold field to your desired value.
- Click Save.
To view and edit advanced settings like alert schedule, trigger conditions, and alert actions, perform the following steps:
- From the Monitoring Console, click Overview > Alerts > Enable or Disable.
- Find the alert you want to configure and click Advanced edit.
- Modify the settings, if desired.
- Click Save.
Manage Health Check: Many health checks already correspond alert for example

Use the health check: Find the health check at Monitoring Console > Health Check.
Start the health check by clicking Start.
Exclude a check
You can disable a specific check to prevent it from running when you click Start:
- Click Monitoring Console > Settings > Health Check Items.
- Locate the check you wish to disable in the list.
- Click Disable.
- Reload Monitoring Console > Health Check.
Modify an existing check
You can modify an existing check. For example, to modify the warning threshold for the Excessive physical memory usage check from 90% to 80%:
- Click Monitoring Console > Settings > Health Check Items.
- In the Excessive physical memory usage row, click Edit.
- Edit the Search and Description fields.
- (Optional) Rename the health check item to reflect your modification.
- Click Save.
Download health check updates
The Health Check page lets you download new health check items provided by the splunk_health_assistant_addon on splunkbase. You can download new health check items as they become available, as follows:
- Click Settings > Monitoring Console > Health Check.
- Click Update Health Checks. If this button is grayed out, then no health check updates are available.
- Login to Splunkbase.
- Click Accept and Continue to install the new health checks.
Export health check results
You can export the results from a health check item to your local machine to share with others.
To export results from a health check item:
- Run the health check.
- Click the row with the results you want to export.
- In the results table on the right, click Export.
- Choose the format of the results (XML, CSV, or JSON). You can also choose a file name and the number of results.
- Click Export.
Hope this blog gave you detail view about DMC & its functionalities. As it’s comes with Splunk itself we don’t need to install. Just configure it and you work is done.
If you are still facing issue regarding this topic Feel free to Ask Doubts in the Comment Box Below and Don’t Forget to Follow us on 👍 Social Networks, happy Splunking >😉


