Splunk provides customers flexibility and ease to leverage their logs by creating knowledge objects such as reports ,alerts etc.Also using power of splunk configuration files we were able to create a robust and scalable environment to meet our splunk needs.
In big organisation multiple users create multiple knowledge objects or create myriad of configuration files which splunk had no track of.Since those are exposed in the environment, any team member can modify/change the objects .This modification may put the customer in a situation were the outcome doesn’t match as expected result.
To overcome this challenge, splunk 9.0 has introduced a new feature called “_configtracker”.The log files which comes from the configuration_change log tracks the configuration as well as creation,updation and deletion changes of the knowledge objects.Users having access to the new internal index=”_configtracker” are able to view logs related to changes in the knowledge objects or config files.
When we search index=”_configtracker” in our splunk 9.0 instance we can see the results
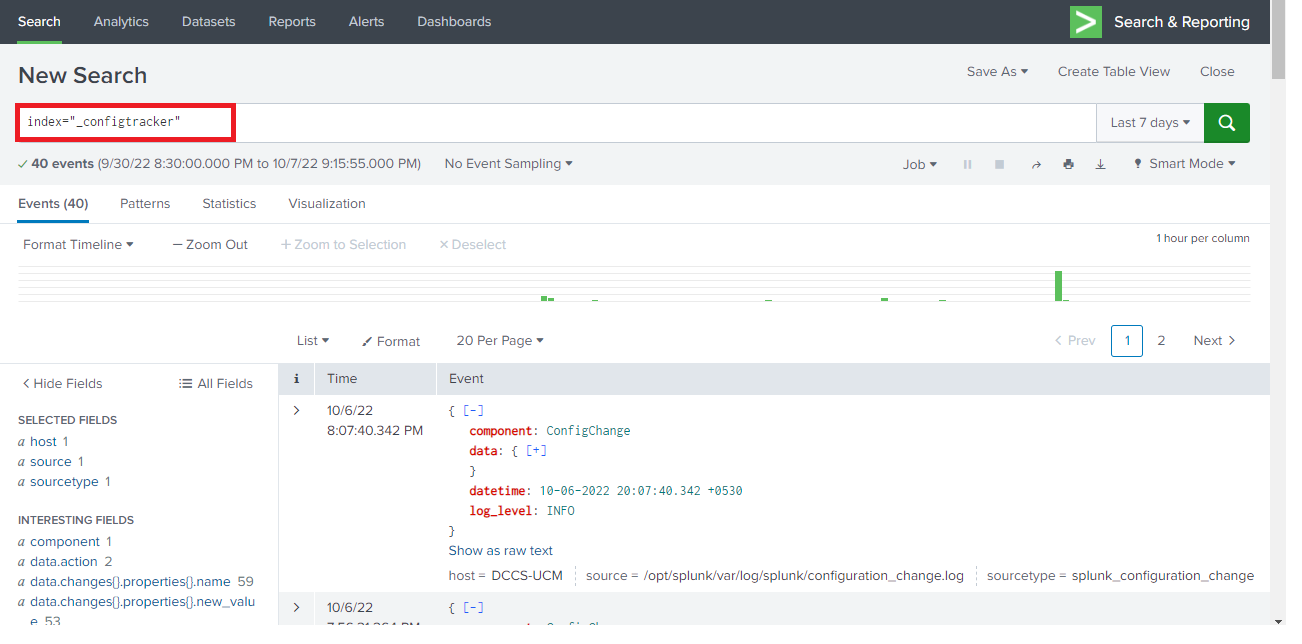
As discussed above the log files comes from source named configuration_change log with sourctype=splunk_configuration_change
The following path/conf files are being monitored under Configuration Change tracker:
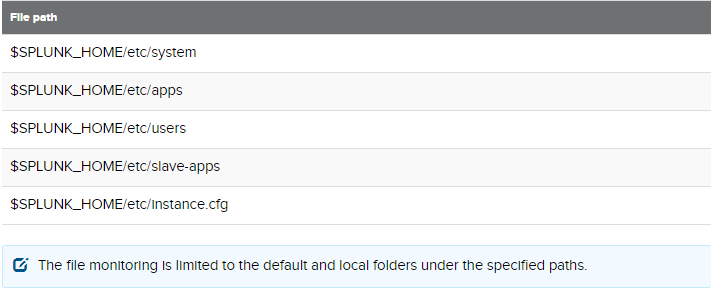
If you want a particular file or path not to be monitored you can blacklist the same in the server.conf stanza named as config_change_tracker under deny_list

Here we have ignored a savedsearches.conf in the clocify app in both the default as well as local folder to be monitored
Lets create a new saved search for report called “Weekly report on Users” who are logged in the particular host and see the changes tracked by config_tracker
index=_audit NOT (user="n/a" OR user="splunk-system-user" OR user="-1" OR "scheduler__nobody__search" OR "nobody") action="login attempt" | chart count over host by user useother=f| addtotals

Now if we query the index=”_configtracker” we are able to see the recently added saved searches as shown below
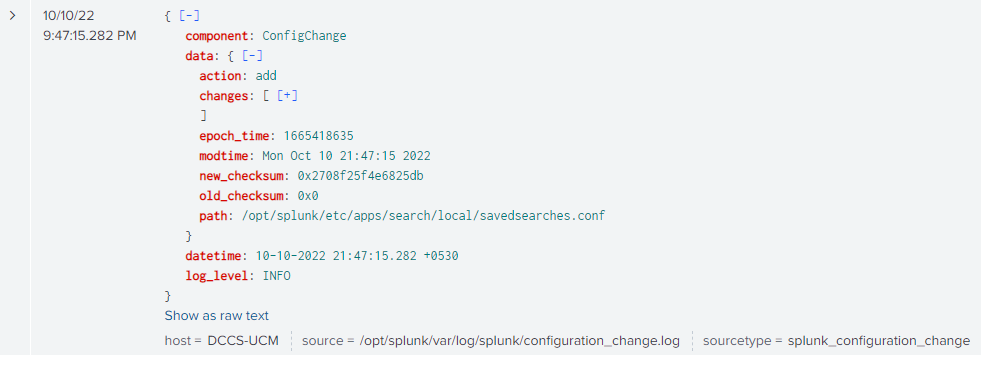
If you expand it by clicking on the “+” icon you can see the stanza name which we have given and also the new as well as old value of the query we have defined as mentioned in the image below
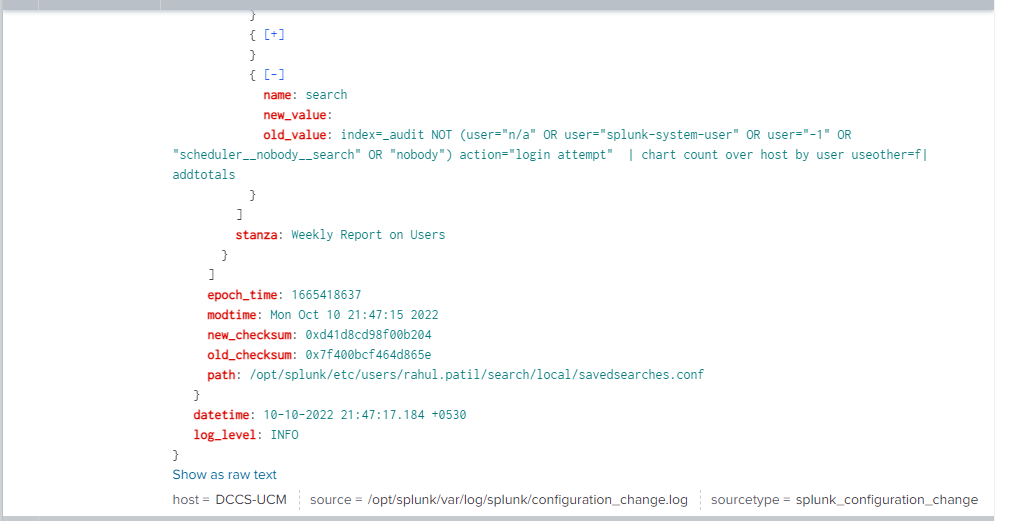
Now lets add some changes in our query and see the logs in the _configtracker
Here we have changed the action=edit_server in our report and saved it

Now if we see the index=”_configtracker” we are able to see the recently modified saved searches as shown below
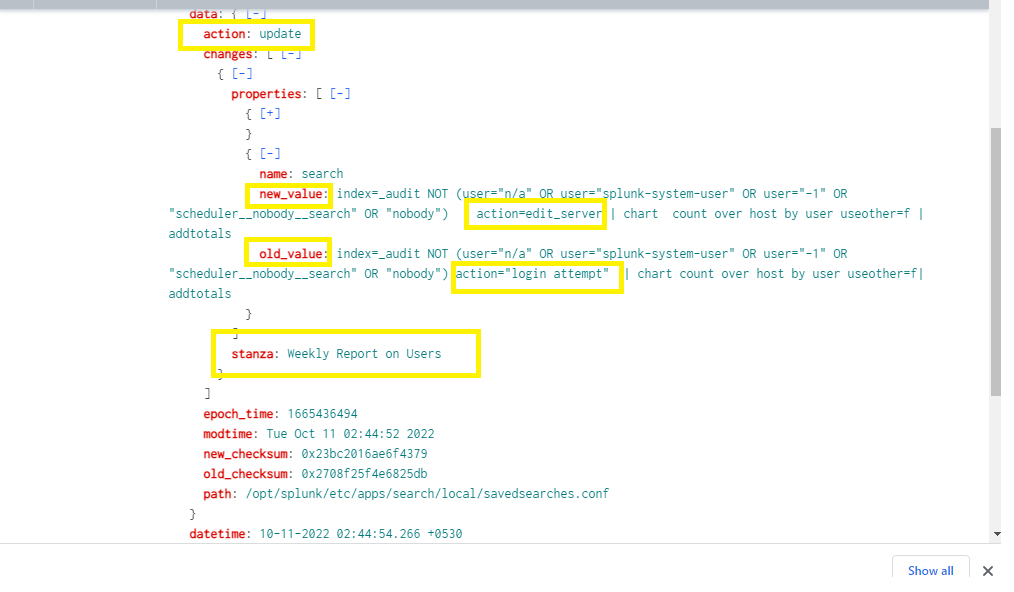
As mentioned, the old value ie action=”login attempt” is been replaced with new value action=”edit_server” for the stanza name /report we have created
If you still have any doubt regarding Configuration tracker in splunk 9.0, Feel free to Ask your Doubts in the Comment Section below ,give your ratings and Don’t Forget to Follow us on 👍 Social Networks.| Happy Splunking 😉


