

In this blog we are going to explore xyseries command in splunk. Xyseries is used for graphical representation.
Why use XYseries command:-
XYseries command is used to make your result set in a tabular format for graphical visualization with multiple fields, basically this command is used for graphical representation.
In xyseries, there are three required arguments: x-field, y-field, and y-data-field.
To understand which order to put your fields in, you need to understand what each field means
- The x-field is the first column its present as x-axis field.
- The y-field is the second column its present as y-axis field and represent as a new field names.
- The y-data-field is the third field represent the data values for the new fields you created in the table.
Syntax:- xyseries [grouped=] … [sep=][format=]
Example:-
A simple stats command as a table:-
index=”_internal” sourcetype=splunkd_ui_access | stats count by method splunk_server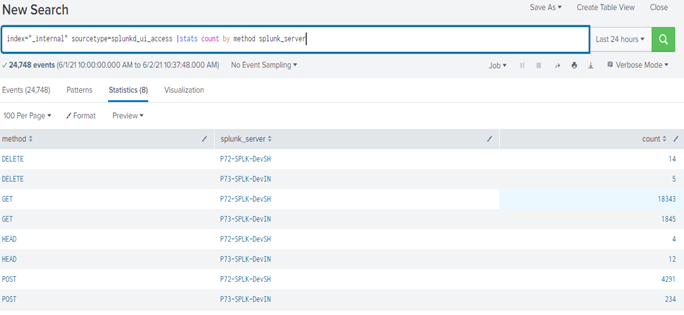
By adding xyseries to that search, you can see that the values from the method and splunk_server column become columns, and the count field becomes the values.
index=”_internal” sourcetype=splunkd_ui_access | stats count by method splunk_server | xyseries method splunk_server
In example we used “method” as x-field . x-field present in the first column of the table.
We used “splunk_server” as a y-field. Y-field indicates each value in new column.
We have used “count” as the y-data-field it represent the values of “count”. “count” field is giving the count of every distinctive combination of values from “method” and “splunk_server” field.
This are some uses of xyseries command for graphical representation.
If you are still facing an issue regarding xyseries command in splunk, Feel free to Ask Doubts in the Comment Section Below and Don’t Forget to Follow us on 👍 Social Networks. Happy Splunking 😉


