🚀This document outlines the seamless migration and configuration process of the Splunk DB Connect Add-on. The objective was to upgrade the existing DB Connect app to the latest stable version while ensuring zero data loss, minimal downtime, and smooth functionality on the same platform. The activity involved deploying the upgraded DB Connect on a new VM, while preserving all existing configurations, identities, database connections, and inputs.
🔽 Follow the steps below to perform a safe and successful migration:
1. Make a backup of the current DB Connect app.
-
Make a backup of the existing DB Connect app directory (
$SPLUNK_HOME/etc/apps/splunk_app_db_connect) before making any modifications. -
Retrieve Encrypted Password from
identities.conf(old passwords are required for configuring identities). -
Encrypted passwords are stored in:
-
Use the following command to decrypt the password:
2. Install the most recent version of the DB Connect add-on.
Download and Install from Splunk Web UI
-
Log in to Splunk Web
-
Go to
http://<your-splunk-host>:8000 -
Log in with an admin account.
-
-
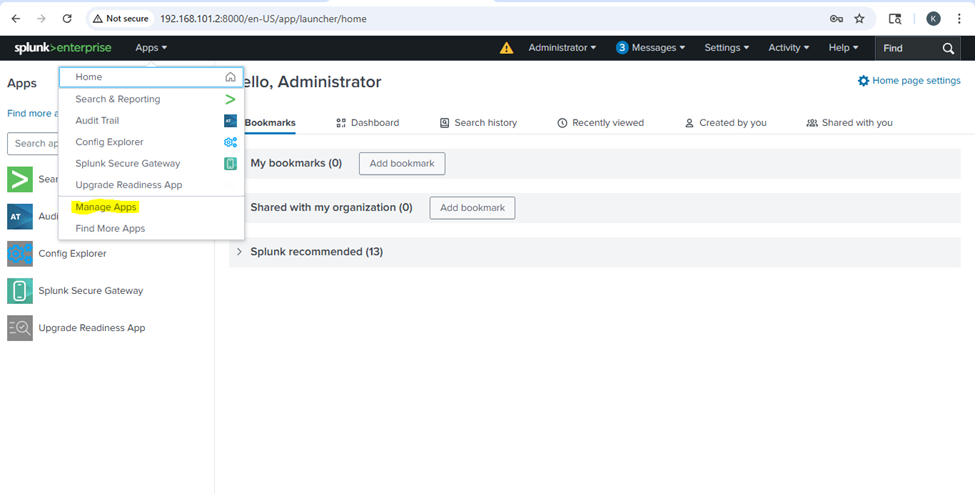
Navigate to Apps
-
Click the gear icon next to “Apps” on the top menu bar or go to Manage Apps.
-
3. Find and Install the App
-
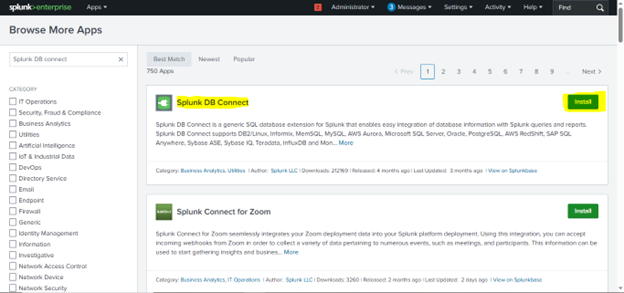
Click on “Browse more apps”.
-
In the search box, type “DB Connect” or “Splunk DB Connect”.
-
Click “Install” next to Splunk DB Connect.
4. Authenticate with Splunk.com
- You may be prompted to enter your Splunk.com credentials to download the app.
5. Restart Splunk (if required)
-
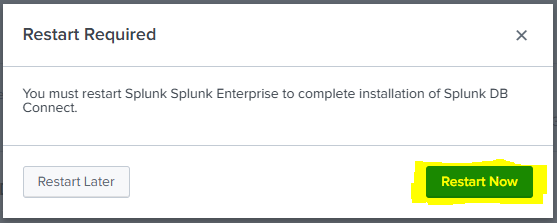
After installation, Splunk may prompt you to restart. Click Restart Now if prompted.
3. Check for JDK Installation in Splunk DB Connect:
-
Open Splunk Web UI
-
Go to:
http://<your-splunk-host>:8000 -
Log in with your credentials.
-
-
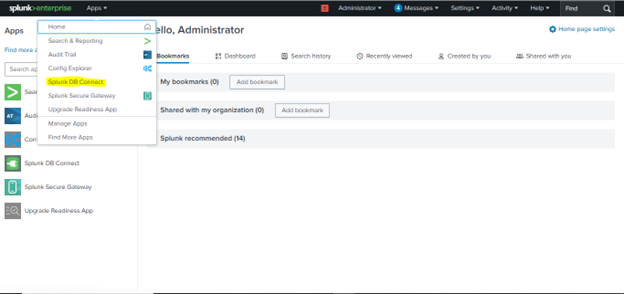
Launch DB Connect App
-
Click on Apps > DB Connect from the top menu.
-
- In the left sidebar of DB Connect, click on “Configuration”.
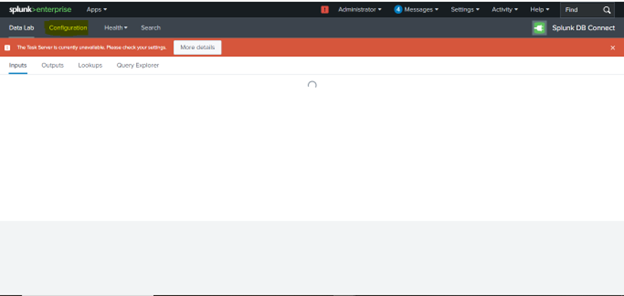
4. Check the Java Tab
-
In the Configuration section, go to the “Settings” > “General” tab (older versions may label this simply as “Java”).
-
Look under Java Home or Java Path.
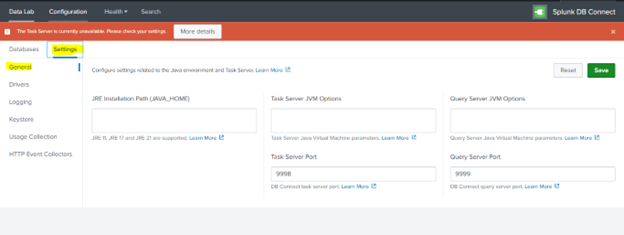

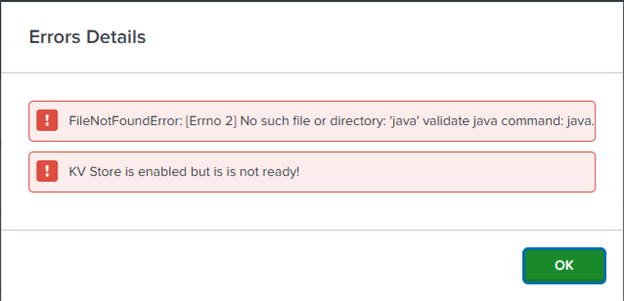
6. Only Java versions are supported. JREs 11, 17, and 21 are supported.
7. Installing JAVA in our Splunk instance (For Linux Redhat OS)
Login to the backend of your Splunk instance and run:
sudo yum install java-21-openjdk

export JAVA_HOME=/usr

echo$JAVA_HOME

java -version
Navigate to:Configuration > Settings > General

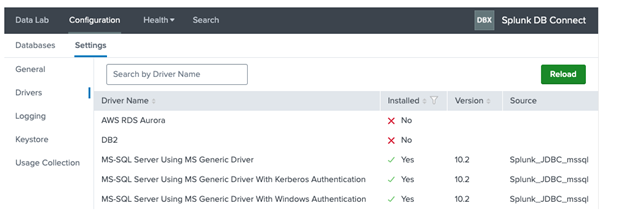
4. Go to Apps > Splunk DB Connect > Configuration > Settings > Drivers and select Java as the language.
-
If you have installed the app, the drivers should appear as installed. The example below depicts the Microsoft SQL Server drivers that have been installed.
-
You can Download any Driver directly from Splunk base from UI. And Restart.
-
Log in to Splunk Web as an admin
-
Open your browser and navigate to your Splunk instance (e.g.,
https://<your-splunk-host>:8000). -
Sign in with an account that has “admin” privileges.
-
Open the “Find More Apps” page
-
In the top navigation bar, click Apps ▾ > Find More Apps.
-
Splunk will load the Splunkbase catalog inside the UI.
-
And Search Splunk DBX Add-on for MySQL JDBC.
-

5. Now Create a basic identity
-
Open Splunk DB Connect
In the Splunk Web UI, click Apps → Splunk DB Connect. -
Navigate to the Identities page
Go to Configuration → Databases → Identities. -
Create a new identity
-
Click the New Identity button.
-
In the dropdown, choose Basic Identity.
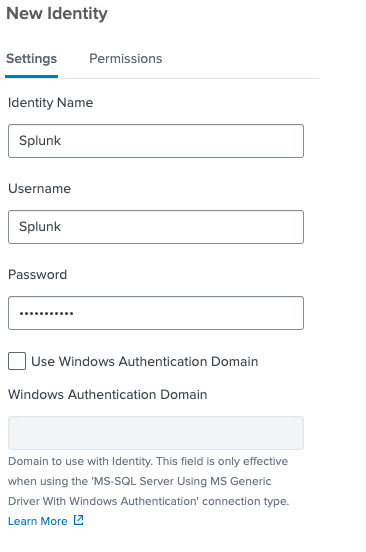
6. Configure the Basic Identity
Fill in the fields as follows (example for SQL Server authentication):
-
-
Name:
sql_server_basic -
Description: (optional) e.g. “SQL Server login for Splunk”
-
Username: the SQL-authorized database user (e.g.
splunk_user) -
Password: the corresponding password
-
Confirm Password: re-enter the password
-
-
Save the identity
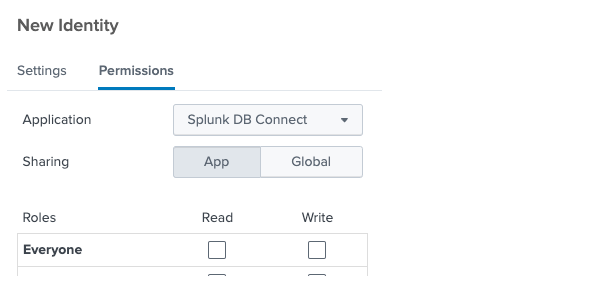
6. Steps to Create the Connection
-
Go to Configuration
Navigate to the Configuration section in your application or portal interface. -
Open Settings
Under Configuration, click Settings to access system configuration options. -
Access Connections
In the Settings menu, select Connections to view existing connections and manage new ones. -
Create a New Connection
Click the New Connection button (typically located at the top right of the Connections page). -
Select or Enter Identity
a. In the new connection setup form:
i. Choose the Identity that you previously created from the dropdown or relevant field.
ii. Fill in other required fields such as connection name, type, or endpoint if prompted.
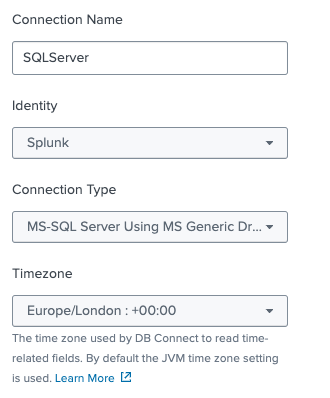
Complete all other configuration details based on your environment or use case (e.g., authentication type, URL, API key).

7. Save the Connection
Once all information is entered, click Save or Create to establish the connection.
8. Verify the Connection
After saving, test or validate the connection to ensure it works correctly.
7. Creating An Input
-
In the Splunk DB Connect app, navigate to Data Lab > Inputs.
-
Click New Input to open the New Input screen.
-
In the Connection dropdown, select the connection you created earlier (e.g., SQLServer).
-
In the Catalog dropdown, choose the database you want to work with.
-
In the Schema dropdown, select the appropriate schema (often dbo).
-
In the Table dropdown, pick the table you wish to index. Splunk will immediately retrieve and display a few sample rows once you select it.

7. If you already have a custom SQL query:
a. Paste your query into the SQL Editor panel.
b. After making any edits, click Execute SQL. (You must click Execute SQL after your edits; otherwise the next steps remain disabled.)
8. To the right of the SQL Editor, set the Input Mode. Typically you’ll choose Event for any results containing non‐numeric values.
9. Choose the Input Type:
a. Batch: Splunk will import all rows matching your query’s time filter.
i. Ensure your SQL query limits results by date (e.g., “WHERE event_date = yesterday”).
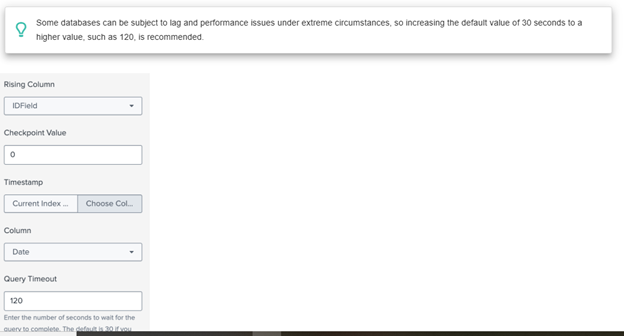
b. Rising: Splunk expects a monotonically increasing column (such as an ID).
i. In your SQL, include a placeholder ? in the WHERE clause (for example, WHERE IDField > ?).
ii. Under Rising Column, specify the name of that column (e.g., IDField).
iii. Set the initial Checkpoint Value (e.g., 0) so Splunk knows where to start.


10. Set the Timestamp field:
a. If your table has a date/time column, choose it so Splunk can timestamp each event correctly.
b. Otherwise, select Current Index Time to use the ingestion time as the timestamp.
11. Expand Input Settings and adjust Query Timeout if needed (the default is 30 seconds). For slower databases, increasing this to, for example, 120 seconds is recommended.
a. Give the new output a Name (e.g.,
SalesDB-Input).b. Optionally enter a Description.
c. Choose the Application context:
i. On a Heavy Forwarder, keep the output in the Splunk DB Connect app so that inputs and outputs remain grouped.
ii. On a Search Head, you may choose another app so that the data inherits that app’s role‐based permissions.

a. Max Rows to Retrieve: Leave at 0 (unlimited) unless you want to throttle how many rows each execution returns.
b. Fetch Size: By default, Splunk retrieves rows in pages of 300. You can lower or raise this to improve performance depending on your environment.
c. Execution Frequency: Specify how often Splunk should run this SQL. You can:
i. Use cron format (e.g.,
0 * * * * to run at the top of every hour).ii. Or enter a number of seconds between runs (e.g.,
3600 once per hour).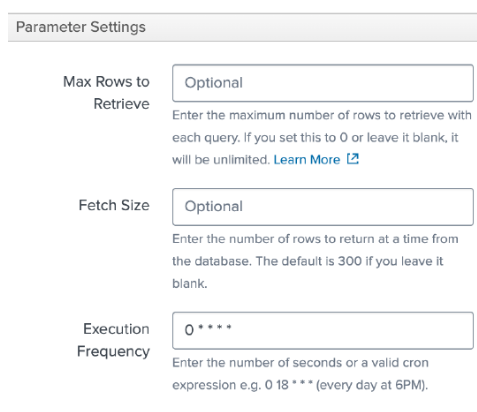
a. Host: Enter the name of the SQL Server machine (not the Splunk host) so you know where the data truly originated.
b. Source: (Optional) You may override this, but by default Splunk DB Connect will set a sensible value.
c. Source Type: Create and select a custom source type (do not use any built‐in source types). This ensures that any sourcetype‐specific field extractions apply only to this data.
d. Index: Choose a non‐default index (never send DB Connect data to the main index). Assigning a dedicated index ensures you can apply separate access controls and avoid “dirty” search results.

15. Click Finish to save the input. Splunk validates the configuration one final time; if everything is correct, the new input is enabled.
16. Finally, switch to Searching & Reporting, and run a search against the index you just configured (for example, index=<your_index> sourcetype=<your_sourcetype>). You should see rows imported as key–value events.

8. DB Connect input health
This dashboard provides pre-built panels to give you insights about your input operation health.
To use the health log dashboard, go to Splunk DB Connect, then click the Health > DB Connect Input Health tab.
The pop-up menus along the top of the window are controls you can use to refine the data in the dashboard.
By default, they show all available data from the last 24 hours.
• Total Errors: The total number of errors for all the inputs.
• %Error: The percentage of the errors among all input jobs.
• Number of Input Jobs over Time: The number of input Jobs over the time you choose.
• Input Jobs Errors over Time: The total errors of input jobs over the time you choose.


