🌟 Introduction
Sysmon (System Monitor) is a powerful Windows system service that logs detailed system activity to the Windows event log. When integrated with Splunk, it provides comprehensive visibility into your Active Directory environment, helping you detect security threats and monitor system behavior.
This guide will walk you through the process of collecting Sysmon data from Active Directory and forwarding it to Splunk for analysis.
🔧 Step 1: Download Sysmon
📥 Download the Sysmon Package
- Navigate to the official Microsoft Sysmon documentation page: Sysmon – Sysinternals | Microsoft Learn
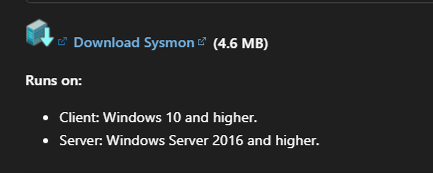
- Scroll to the bottom of the page to find the download link
- Download the Sysmon package (ZIP file) to your target machine
💡 Tip: Always download Sysmon from the official Microsoft Sysinternals website to ensure you’re getting the legitimate, unmodified version.
💻 Step 2: Install Sysmon on Client Machines
📂 Extract and Install
- Extract the ZIP file to a convenient location (e.g.,
C:\Tools\Sysmon) - Open Command Prompt with Administrator privileges
- Press
Win + Xand select “Command Prompt (Admin)” or “Windows PowerShell (Admin)” - Or search for “cmd”, right-click, and select “Run as administrator”
- Press
- Navigate to the Sysmon directory
cd C:\Tools\Sysmon
- Run the installation command
sysmon -accepteula -i
This command will:
- Accept the End User License Agreement automatically
- Install Sysmon with default configuration
- Start the Sysmon service
✅ Verify Installation
After installation, verify that Sysmon is running:
sc query Sysmon64
You should see the service status as “RUNNING”.
⚙️ Advanced Configuration: For production environments, consider using a custom Sysmon configuration file (e.g., SwiftOnSecurity’s configuration) by running:
sysmon -accepteula -i sysmonconfig.xml

📊 Step 3: Configure Event Collection in Active Directory
🔍 Set Up Event Subscription
- Open Event Viewer on your Active Directory server
- Press
Win + R, typeeventvwr.msc, and press Enter
- Press
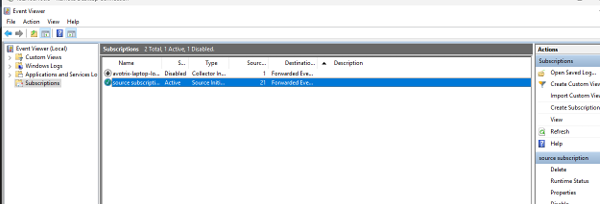
- Navigate to your created subscription
- Go to Subscriptions in the left panel
- Select your existing subscription or create a new one
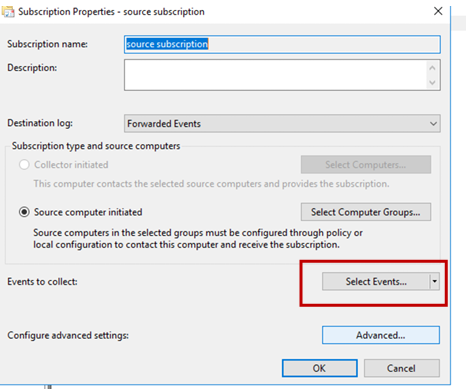
- Select Events to Monitor
- Click on Select Events button
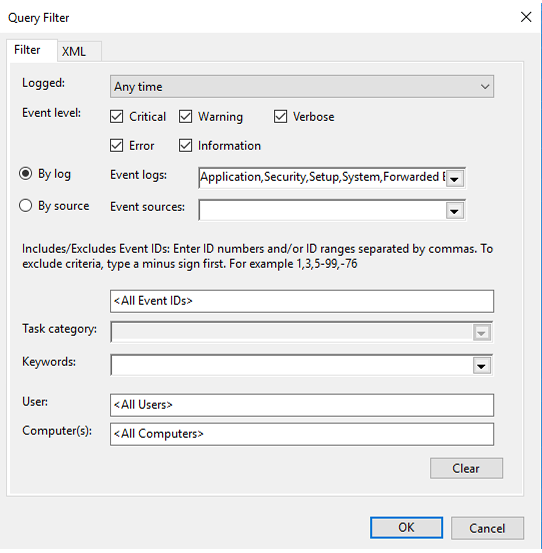
- Choose By log option
- Configure Sysmon Event Collection
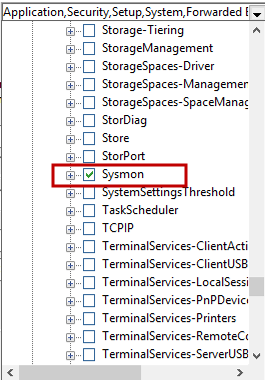
- Expand: Application and Services Logs → Microsoft → Windows → Sysmon → Operational
- Select the Sysmon events you want to monitor
📌 Common Sysmon Event IDs to Monitor:
| Event ID | Description |
|---|---|
| 1 | Process Creation |
| 3 | Network Connection |
| 7 | Image/DLL Loaded |
| 8 | CreateRemoteThread |
| 10 | ProcessAccess |
| 11 | FileCreate |
| 12-14 | Registry Events |
| 22 | DNS Query |
🚀 Step 4: Configure Splunk Universal Forwarder
📝 Enable Sysmon Logs in Splunk
- Locate the inputs.conf file
- Path:
C:\Program Files\SplunkUniversalForwarder\etc\system\local\inputs.conf - Or:
C:\Program Files\SplunkUniversalForwarder\etc\apps\<your_app>\local\inputs.conf
- Path:
- Edit inputs.conf with administrative privileges
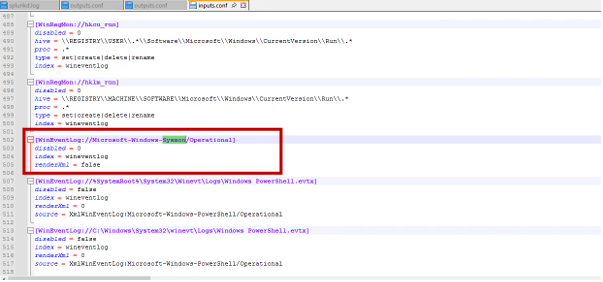
- Add Sysmon log collection stanza:
[WinEventLog://Microsoft-Windows-Sysmon/Operational]
disabled = 0
index = windows
sourcetype = XmlWinEventLog:Microsoft-Windows-Sysmon/Operational
renderXml = true - Save the file
- Restart Splunk Universal Forwarder
If you are still facing an issue, feel free to Ask Doubts in the Comment Section Below and Don’t Forget to Follow us on 👍 Social Networks.
| Happy Splunking 😉


